Multiple WorkflowInterceptor instances may be applied to any workflow type. Every message that is processed by a workflow will have each WorkflowInterceptor applied to it, at the start and at the end of the workflow, in order of configuration. The WorkflowInterceptor interface itself is very simple and is easily extensible for your own custom implementations. Example configuration for an interceptor may be found in docs/example-xml/Interlok-Base/workflows
The current interceptors available as part of a standard installation are throttling-interceptor, metadata-totals-interceptor, metadata-count-interceptor, message-metrics-interceptor and message-metrics-interceptor-by-metadata; Apart from the throttling-interceptor they provide some coarse grained statistics about the throughput of a given workflow. These statistics are made available over JMX, and widgets displayed in the web UI based on the unique-id associated with each interceptor. If finer details are required, then it is suggested that you use the optional profiler implementation to capture those statistics.
Since 3.0.4 we have introduced three new JMX notification emitters slow-message-notification, message-threshold-notification and message-count-notification. These interceptors emit a JMX notification when various thresholds are exceeded. In the case of slow-message-notification a JMX notification is emitted whenever a message exceeds the configured threshold; the notification will contain limited information about the message (such as the message unique id, and whether it was successful or not). For message-threshold-notification a notification is emitted whenever the total message count/size/number of errors exceeds the configured threshold.
Throttling Interceptor
The throttling-interceptor limits the number of messages that are processed by a workflow over a given time-period. The same throttle can be applied over multiple workflows provided every configured throttling-interceptor references the same cache-name.
<throttling-interceptor>
 <time-slice-interval>
  <unit>MINUTES</unit>
  <interval>1</interval>
 </time-slice-interval>
 <maximum-messages>60</maximum-messages>
 <cache-provider class="time-slice-default-cache-provider"/>
 <cache-name>60msgsPerMinute</cache-name>
</throttling-interceptor>
If both workflowA and workflowB have the above configuration, then the sum of messages passing through them cannot exceed 60 messages per minute. If it does; then messages will be delayed in both workflows until a new time slice rolls over.
Metadata Totals Interceptor
metadata-totals-interceptor is a workflow interceptor that captures statistics about metadata values that are numbers (integers). Each message that passes through the interceptor will be queried in turn for each configured metadata key. The integer value associated with that key will be added to the existing total for that key within the given time period. The general use-case is when you capture a count of some description (e.g. number of lines), store it against metadata, and to keep a running total of that number for a given time interval. The counts are exposed for capture and display. Note that if the metadata keys contain non-numeric values, then results are undefined (at the very least you will get NumberFormatException being thrown).
Given the following configuration, and the scenario that the values associated with the metadata keys OrderValue and NumberOfUnits will contain integer values, then we capture the total sum of those values for each time period.
<metadata-totals-interceptor>
 <unique-id>OrderTotals</unique-id>
 <timeslice-duration>
  <unit>MINUTES</unit>
  <interval>5</interval>
 </timeslice-duration>
 <timeslice-history-count>100</timeslice-history-count>
 <metadata-key>OrderValue</metadata-key>
 <metadata-key>NumberOfUnits</metadata-key>
</metadata-totals-interceptor>
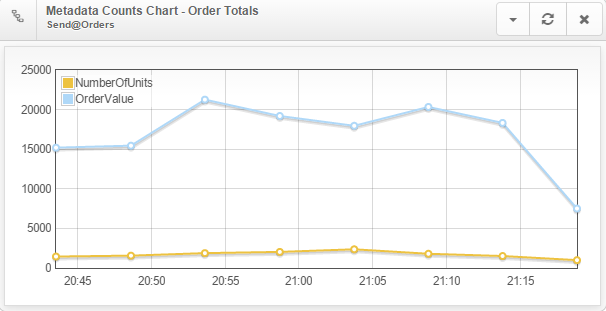
Metadata Count Interceptor
metadata-count-interceptor is an interceptor that exposes metrics about metadata values via JMX. Each message that passes through the interceptor will be queried in turn for each metadata key. The string value associated with that key will be added to the existing total for that value within the given time period. Effectively this interceptor counts the number of times a given metadata value is processed by the workflow within a given time period.
Given the following configuration, and the scenario that the value associated with the metadata key UnitType will be one of Laptop, Smartphone, Desktop, Tablet, then we capture the number of times over the specified period that a message contains each of those values.
<metadata-count-interceptor>
 <unique-id>OrdersByUnitType</unique-id>
 <timeslice-duration>
  <unit>MINUTES</unit>
  <interval>5</interval>
 </timeslice-duration>
 <timeslice-history-count>100</timeslice-history-count>
 <metadata-key>UnitType</metadata-key>
</metadata-count-interceptor>
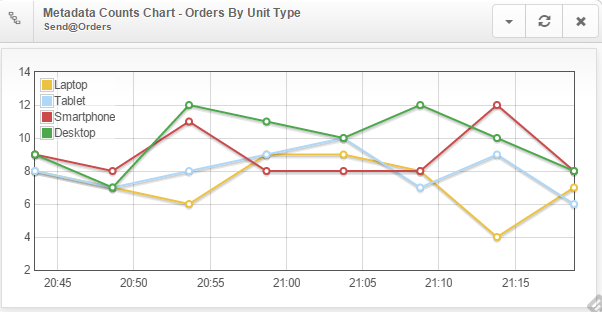
Message Metrics Interceptor
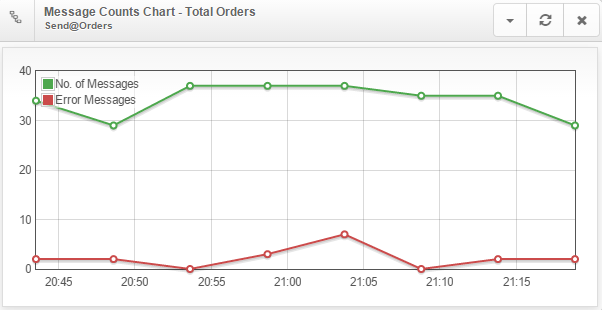
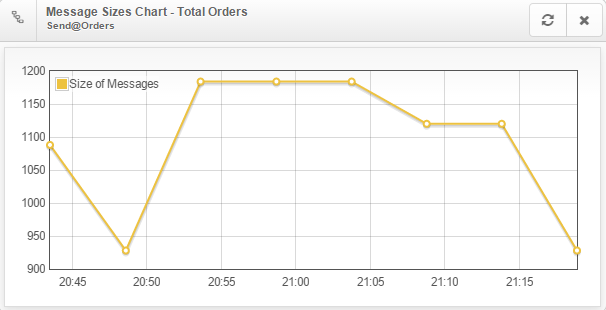
message-metrics-interceptor is an interceptor that exposes information about messages processed by the workflow. It captures the total number of messages that passed through this workflow, and captures the size of messages entering the workflow (but not the total size of messages exiting the workflow); and also the number of messages that had an error condition at the end of the workflow.
Since 3.0.3 a message-metrics-interceptor is automatically added to all workflows (unless one already exists) which can be uniquely identified (the workflow has a unique-id, and the channel has a unique-id). The default captures 12 timeslices each lasting 5 minutes, which will essentially give you the last hour’s worth of messages. This behaviour can be disabled by setting disable-default-message-count=true on the workflows which don’t require it.
<message-metrics-interceptor>
 <unique-id>TotalOrders</unique-id>
 <timeslice-duration>
  <unit>MINUTES</unit>
  <interval>5</interval>
 </timeslice-duration>
 <timeslice-history-count>100</timeslice-history-count>
</message-metrics-interceptor>
Message Metrics By Metadata
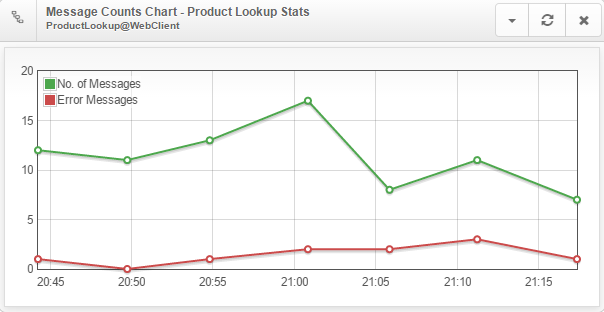
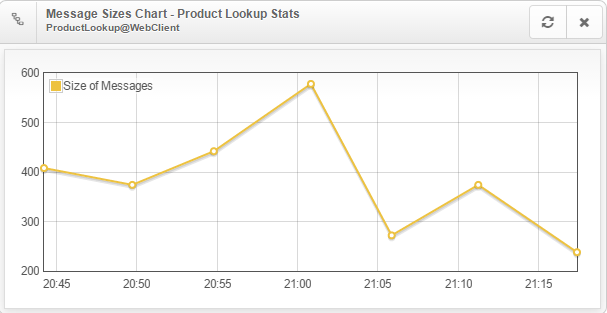
message-metrics-interceptor-by-metadata is an interceptor that captures metrics about messages that match a given metadata criteria. This captures information about a message where that message contains the specified key and and value combination, the value portion may be a regular expression. If the message metadata matches that configured, then it captures the total number of messages that passed through this workflow, and captures the size of messages entering the workflow (but not the total size of messages exiting the workflow); and also the number of messages that had an error condition at the end of the workflow.
Given the following configuration, and the scenario that the value associated with the metadata key messageType might be PRODUCT_LOOKUP, then we capture the number of times over a given time interval that it was actually PRODUCT_LOOKUP.
<message-metrics-interceptor-by-metadata>
 <unique-id>ProductLookupStats</unique-id>
 <timeslice-duration>
  <unit>MINUTES</unit>
  <interval>5</interval>
 </timeslice-duration>
 <timeslice-history-count>100</timeslice-history-count>
 <metadata-element>
  <key>messageType</key>
  <value>PRODUCT_LOOKUP</value>
 </metadata-element>
</message-metrics-interceptor-by-metadata>
Slow Message Notification
slow-message-notification emits a notification when the time taken by a message to transit the workflow exceeds the configured time interval. The javax.management.Notification#getUserData is populated with a java.util.Properties object which contains some limited information about the message that exceeded the threshold. This interceptor will register a NotificationBroadcasterSupport instance against com.adaptris:type=Notifications MBean tree, based on the adapter/channel/workflow hierarchy. (e.g. com.adaptris:type=Notifications,adapter=XXX,channel=YYY,workflow=ZZZ,id=SlowMessages)
Given the following configuration; a JMX notification will be emitted every time a message takes over 30 seconds to process.
<slow-message-notification>
 <unique-id>SlowMessages</unique-id>
 <notify-threshold>
  <unit>SECONDS</unit>
  <interval>30</interval>
 </notify-threshold>
</slow-message-notification>
Message Threshold Notification
message-threshold-notification captures metrics in a similar fashion to message-metrics-interceptor but does not keep any history. If any threshold (total message count, total error count, total message size) is exceeded for the current timeslice then a notification is emitted. The javax.management.Notification#getUserData is populated with a java.util.Properties object which contains information about the current timeslice metric. This interceptor will register a NotificationBroadcasterSupport instance against com.adaptris:type=Notifications MBean tree, based on the adapter/channel/workflow hierarchy. (e.g. com.adaptris:type=Notifications,adapter=XXX,channel=YYY,workflow=ZZZ,id=MessageThreshold)
Given the following configuration; a JMX notification will be emitted whenever the number of messages processed in the current timeslice exceeds 20 within a given 30 second period.
<message-threshold-notification>
 <unique-id>MessageThreshold</unique-id>
 <timeslice-duration>
  <unit>SECONDS</unit>
  <interval>30</interval>
 </timeslice-duration>
 <count-threshold>20</count-threshold>
</message-threshold-notification>
Message Count Notification
message-count-notification emits notifications based on the number of messages passing through the workflow. A Notification with the message “Message Count Above Boundary” will be emitted when the message count threshold is first exceeded in the last complete timeslice. Notifications will continue being emitted for as long as the message count is greater than the threshold and the maximum number of notifications has not been exceeded. When the message count dips below the threshold a notification with the message “Message Count Below Boundary”. The javax.management.Notification#getUserData is populated with a java.util.Properties object which contains information about the timeslice which caused the notification. This interceptor will register a NotificationBroadcasterSupport instance against com.adaptris:type=Notifications MBean tree, based on the adapter/channel/workflow hierarchy. (e.g. com.adaptris:type=Notifications,adapter=XXX,channel=YYY,workflow=ZZZ,id=MessageCount)
Notifications are only generated based on the last complete timeslice that was recorded when a new message enters the workflow. Bearing in mind that a workflow which does not process any messages will never fire the interceptor; this means that notifications are not generated until the current timeslice rolls over and a message processed by the workflow. There may be delays in notifications based on the spikiness of the traffic and the granularity of the timeslice duration.
Given the following configuration; a JMX notification will be emitted whenever the number of messages processed in the last complete timeslice exceeds 10 with a maximum of 3 notifications.
<message-count-notification>
 <unique-id>MessageCount</unique-id>
 <timeslice-duration>
  <unit>MINUTE</unit>
  <interval>1</interval>
 </timeslice-duration>
 <message-count>10</message-count>
 <max-notifications>3</max-notifications>
</message-count-notification>
For a following sequence pattern of message throughput; we can expect the notifications to happen according to the following table :
| Time | MsgCount | Upper Boundary Notification | Lower Boundary Notification |
|---|---|---|---|
| 00:00 - 00:59 | 11 | No (no previous timeslice) | No |
| 01:00 - 01:59 | 12 | Yes (MsgCount = 11 from 00:00-00:59) | No |
| 02:00 - 02:59 | 13 | Yes (MsgCount = 12 from 01:00-01:59) | No |
| 03:00 - 03:59 | 00 | No (interceptor not fired) | No (interceptor not fired) |
| 04:00 - 04:59 | 11 | Yes, (MsgCount = 13 from 02:00-02:59) | No |
| 05:00 - 05:59 | 01 | No | No |
| 06:00 - 06:59 | 11 | No | Yes (MsgCount = 1 from 05:00-05:59) |
| 07:00 - 07:59 | 12 | Yes (MsgCount = 11 from 06:00-06:59) | No |
| 08:00 - 08:59 | 13 | Yes (MsgCount = 12 from 07:00-07:59) | No |
| 09:00 - 09:59 | 14 | Yes (MsgCount = 13 from 08:00-08:59) | No |
| 10:00 - 10:59 | 15 | No, as max exceeded | No |
| 11:00 - 11:59 | 01 | No, as max exceeded | No |
| 12:00 - 12:59 | 02 | No | Yes (MsgCount = 1 from 11:00-11:59) |
| 13:00 - 13:59 | 03 | No | Yes (MsgCount = 2 from 12:00-12:59) |
| 14:00 - 14:59 | 04 | No | Yes (MsgCount = 3 from 13:00-13:59) |
| 15:00 - 15:59 | 04 | No | No, as max exceeded |

