Getting Started
To access the Runtime Widgets page, you use the widgets button on the header navigation bar.
The header navigation bar:

The widgets page action:

The widgets page is made up of 2 parts, the widgets action bar and the configured widgets.
The widgets action bar
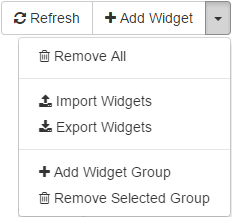
The actions are as follows:
| Button | Action | Meaning |
|---|---|---|
 |
Add Widget | Add a widget to the widgets page |
 |
Refresh All | Refresh all the data in each widget |
 |
Remove All | Remove all the widgets |
 |
Import Widgets | Import widgets from a json file (Since 3.4) |
 |
Export Widgets | Import widgets to a json file (Since 3.4) |
 |
Add Widget Group | Add a widget group (Since 3.4) |
 |
Remove Selected Widget Group | Remove the selected widget group (Since 3.4) |
The configured widgets
Runtime widget page examples
This section shows examples of what the widgets page looks like.
Various widgets configured on the widgets page:
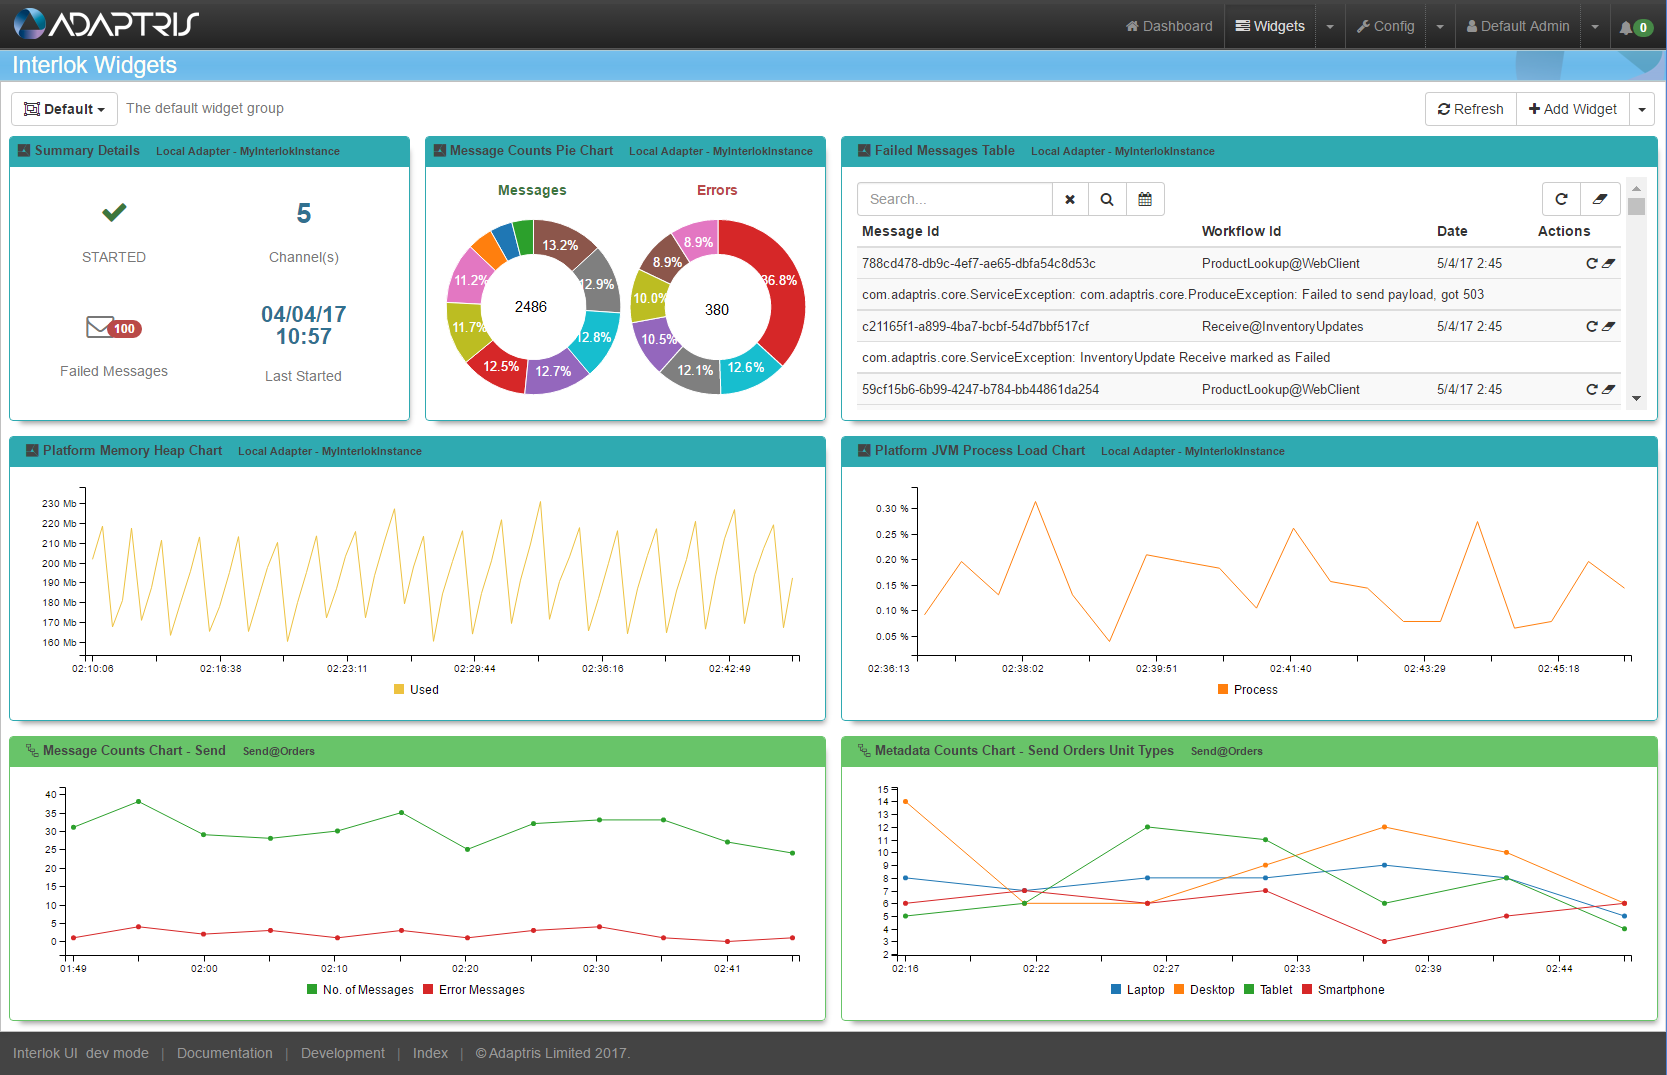
Configured widgets on the page, but shown in a small screen resolution:

Without widgets configured:

A Runtime widget explained
An example widget:
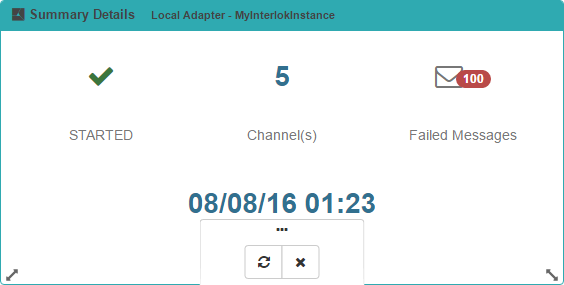
Each widget is made up of a title bar and a body. The title bar

contains:
 the widget icon: This icon can be used to re-order the widgets on the widgets page. You would click and hold the mouse button down and drag the widget around on the page and this will change the order that the widgets are shown on this page.
 the widget-type icon & the widget description
 or
or  widgets action bar containing action buttons, these actions are as follows:
 This action will remove the widget from the page, pressing this icon will also show a confirmation to close, before removing the widget
 This action will refresh the data inside the widget
 This action will clear statistics data for the Workflow interceptor(s) used by the widget(Since 3.4)
 This action shows options for the widget
 This action will resize the widget(Since 3.4)
Add runtime widget feature
To add a runtime widget to the widgets page you would have to click on the add widget button in the widget page action bar :

Pressing the add widget button would bring up the add widget modal:
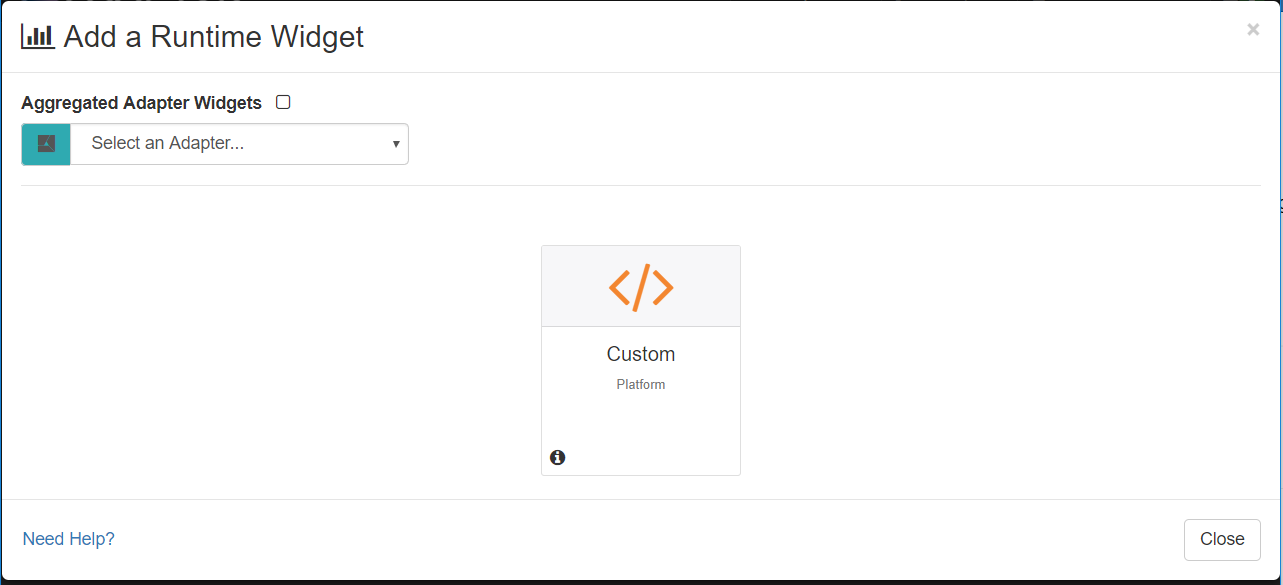
Using the add widget form, you select an Interlok container using the container selector:

This will then show available widgets for that container and it’ll also show the channel selector:
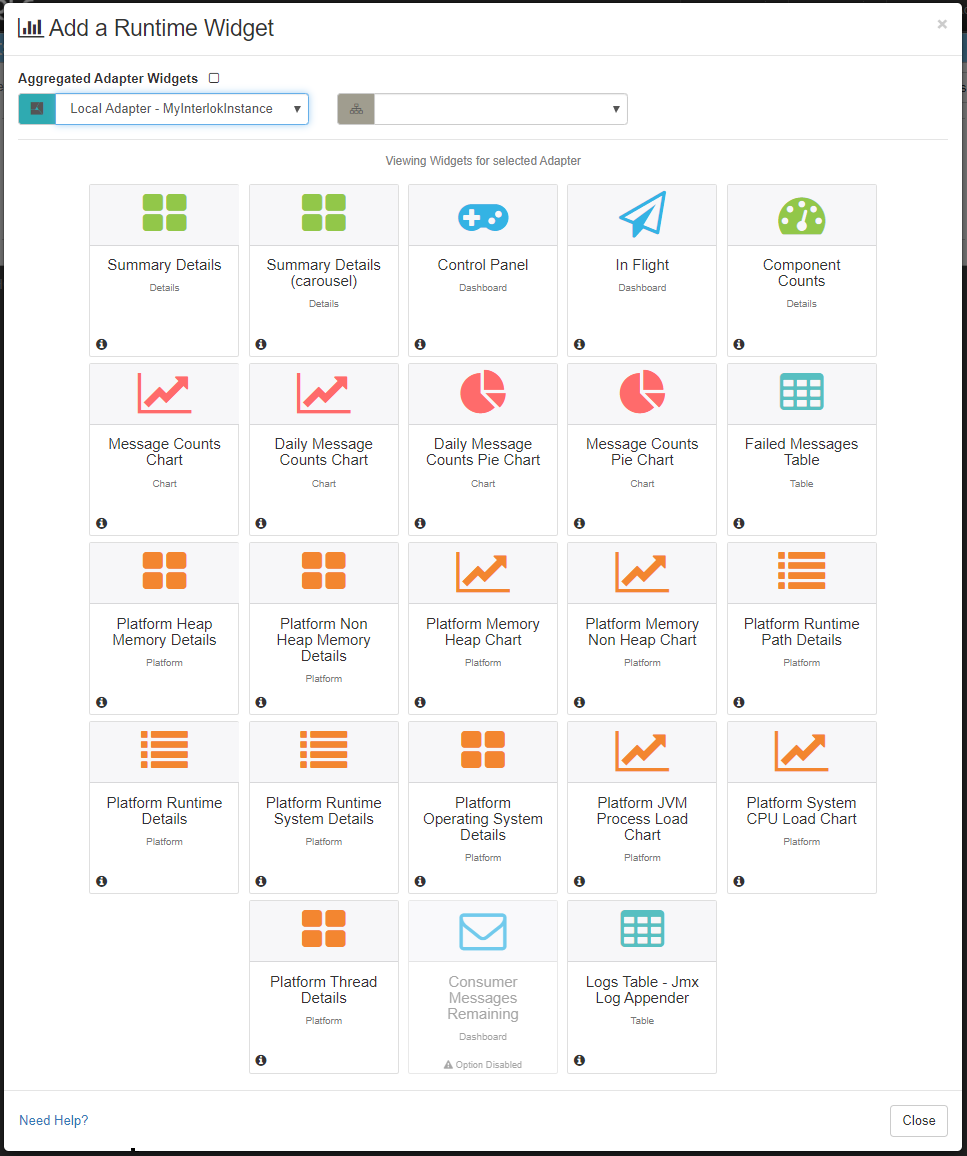
To select a widget to add, you would click on one of the various widget icons from the available widgets area, for example:
 add the details widget for the selected component
 add the failed messages widget for the selected component
- and so on.
If you would like a channel widget, then you would select a channel from the channel selector,

After selecting a channel, the available widgets for the given channel would be available to click. And also, the workflow selector would show.
If you’d like a workflow widget, then you would select a workflow from the workflow selector

Once you’ve clicked on a widget icon, the widget is added to the page and the add widget modal is closed. On the add widget modal, to navigate from the workflows widgets to the channel widgets, you would select the blank option in the workflow selector and you’ll traverse back to the channel widgets. To navigate from the channel widgets to the container widgets, you would select the blank option from the channels selector.
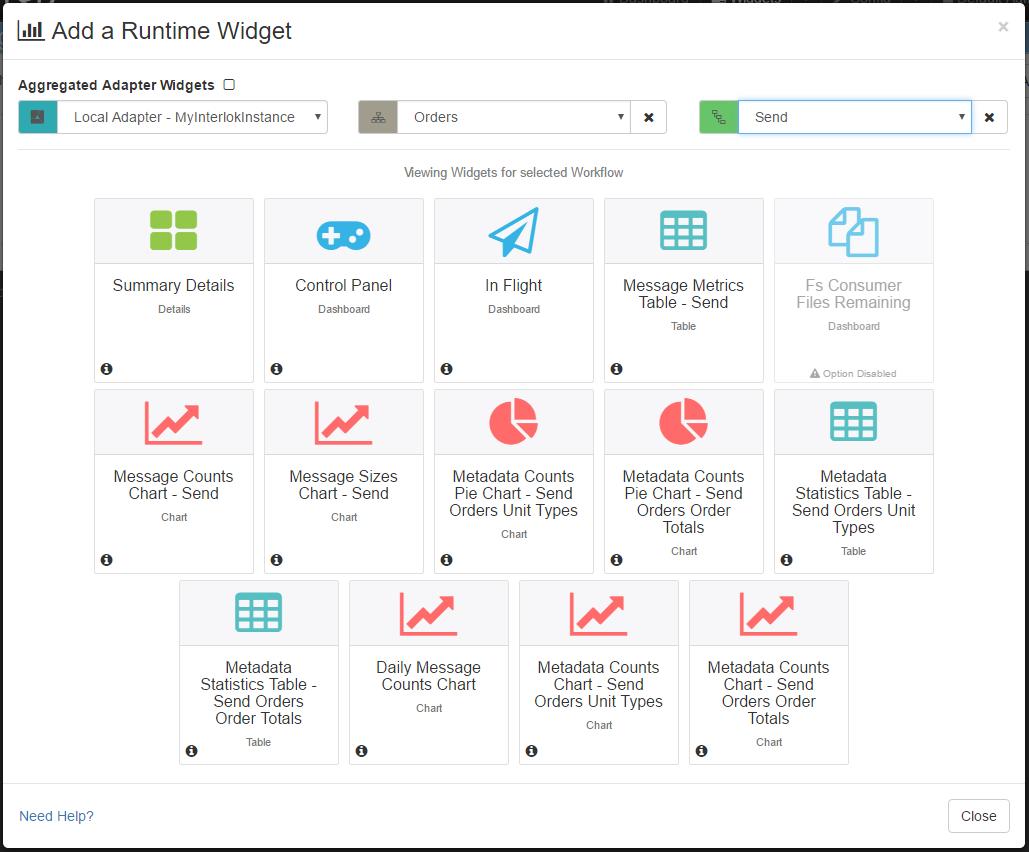
Example of the add modal with a channel and workflow selected:
Container Widgets
Details Widget
This widget shows basic details for the selected container.
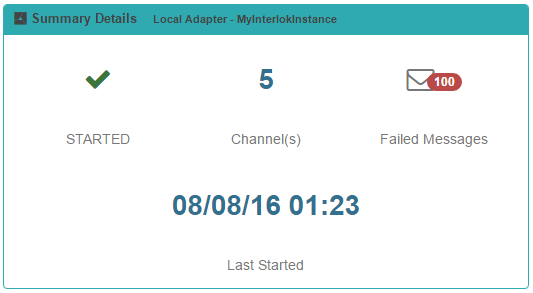
This widget shows:
- Container status
- Number of channels that the container has configured
- Failed message count for the given container
- The last started (or last stopped) timestamp for this container
Message Counts Chart
This widget shows a chart that details the amount of messages that the workflows within this container have processed.

This chart shows:
- The X axis shows the time
- The Y axis shows the amount of messages processed
- Each line represents a workflow
You can toggle which workflow you want to see on the graph by clicking on the workflow’s labels. The the workflow’s labels which are greyed out will not appear on the graph.
In order to use the stats and metrics widgets you need the correct config. You need a message-metrics-interceptor configured, which will gather the data that’s being shown on this widget.
message-metrics-interceptors configured at a workflow level which will gather the data that can be shown on this widget.Daily Message Counts Chart
This widget is similar to Message Counts Chart but keeps data for 24 hours. (Since 3.5.1)
Message Counts Pie Chart
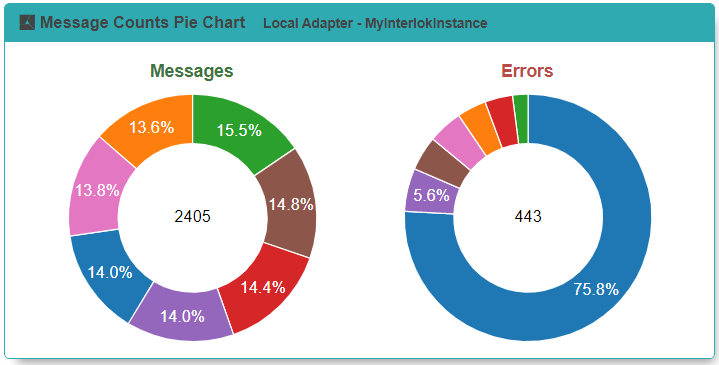
This widget shows a chart that shows the amount of messages that the workflows within this container have processed.
In order to use the stats and metrics widgets you need the correct config. You need a message-metrics-interceptor configured, which will gather the data that’s being shown on this widget.
message-metrics-interceptors configured at a workflow level which will gather the data that can be shown on this widget.Daily Message Counts Pie Chart
This widget is similar to Message Counts Pie Chart but keeps data for 24 hours. (Since 3.9.2)
Control Panel
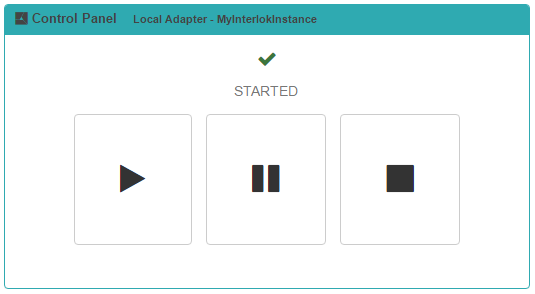
This widget allows quick control (Start, Close, Stop) of the adapter from the runtime page. (Since 3.4)
Failed Messages
This widget show a table detailing the current failed messages for a given container.
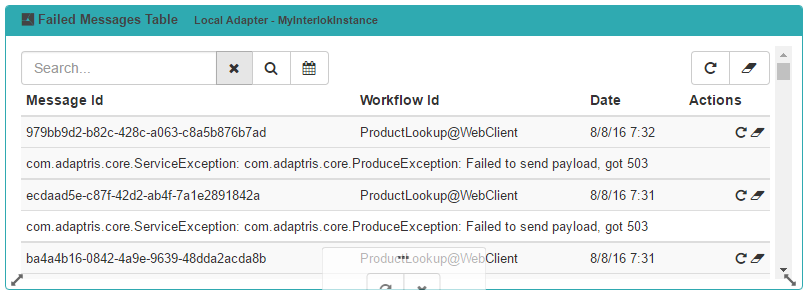
This table shows:
- The failed message id
- The workflow is that the failed message came from
- The date and time that the message failed
- The failed message error description
- An action button allowing you to retry the failed message In order to use the failed message retry action on this widget you need the correct config. You need a failed-message-retrier configured, which will allow a failed message to be reprocessed.
Logging
This widget allows you to see the containers logging information in a tabular format.
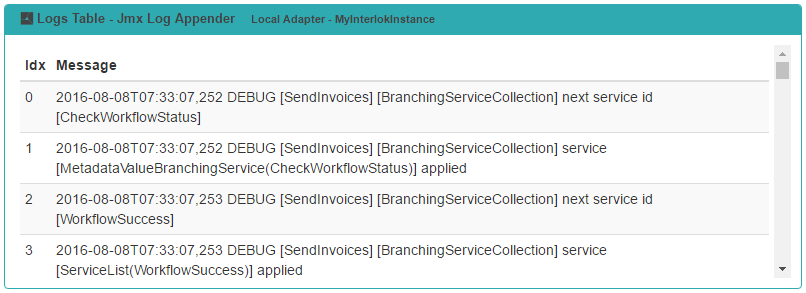
The table shows the time slice id of when the log message occurred and the logging message (the format of which is configured in log4j).
In the widgets actions, as well as the standard refresh and close, you’ll notice a number input, this allows you to configure the amount of messages you wish this widget to show; 200 is set as a default figure, so when message 201 is displayed, message 1 would be discarded.
If the logging widget isn’t available, you will have to configure jmx logging within the container config.
For example in the containers config/log4j2.xml you would add a new appender:
<JmxLogAppender name="JmxLogAppender">
	<PatternLayout>
		<Pattern>%d{ISO8601} %-5p [%t] [%c{1}] %m%n</Pattern>
    </PatternLayout>
	<filters>
		<ThresholdFilter level="info"/>
	</filters>
</JmxLogAppender>
And you would have to add a new element to the root element:
<Root level="TRACE">
	<AppenderRef ref="Console"/>
	<AppenderRef ref="JmxLogAppender"/>
</Root>
You can configure multiple jmx loggers, for instance with different thresholds or to monitor different packages and you will get the corresponding number of logging widgets.
As well as log4j config, you would have to put the interlok-logging.jar into the containers lib folder.
Container Platform Widgets
Platform Runtime Details
This widget shows basic information about the platform running the Interlok container.
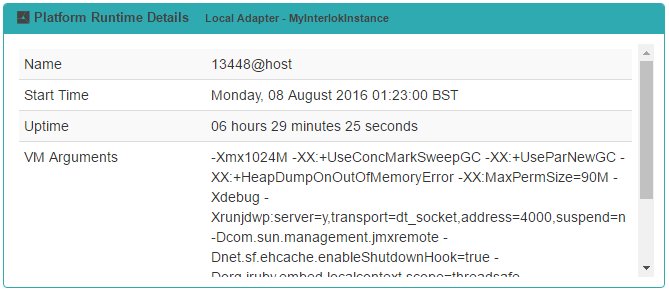
This widget shows the basic data from the RuntimeMXBean
- Name - the name representing the running Java virtual machine.
- Start Time - the start time of the Java virtual machine in milliseconds.
- Uptime - the uptime of the Java virtual machine in milliseconds.
- Vendor - the Java virtual machine implementation vendor.
- Virtual Machine - the Java virtual machine implementation name combined with the Java virtual machine implementation version.
Platform Runtime Classpath
This widget shows the containers java Classpath.
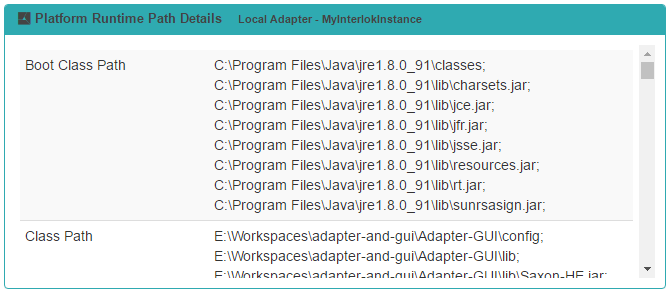
This widget shows the classpath data from the RuntimeMXBean
- Boot Class Path – the boot class path that is used by the container.
- Class Path – the Java class path that is used by the container.
- Library Path - the Java library path.
Platform System Properties
This widget shows the containers runtime system properties
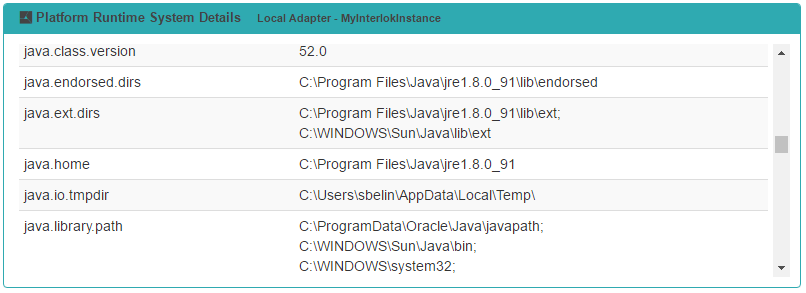
This widget shows the names and values of all system properties from the RuntimeMXBean
Platform Operating System
This widget shows information regarding the system details.
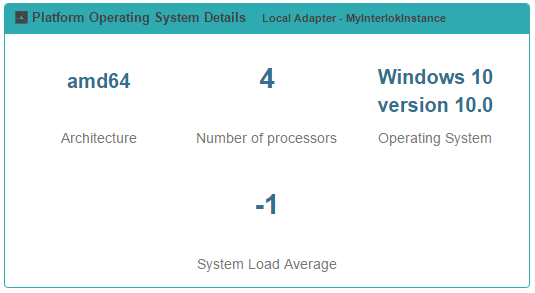
This widget shows the data from the OperatingSystemMXBean
- Architecture – the operating system architecture.
- Number of processors – the number of processors available to the Java virtual machine
- Operating System – the operating system name combined with the operating system version.
- System Load Average - the system load average for the last minute.
Platform Thread Details
This widget shows information regarding the platforms threading data.
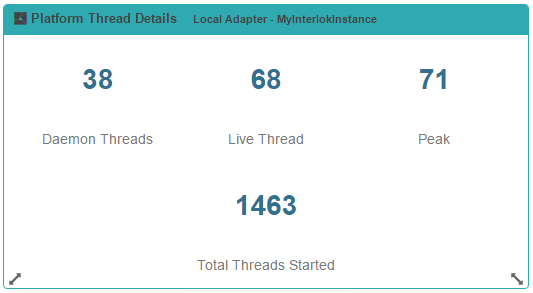
This widget shows the data from the ThreadMXBean
- Live Thread – the current number of live threads including both daemon and non-daemon threads.
- Daemon Threads – the current number of live daemon threads.
- Peak – the peak live thread count since the Java virtual machine started or peak was reset.
- Total Threads Started -the total number of threads created and also started since the Java virtual machine started.
Platform System CPU Load
This widget contains data concerning the cpu usage for the platform running this container.
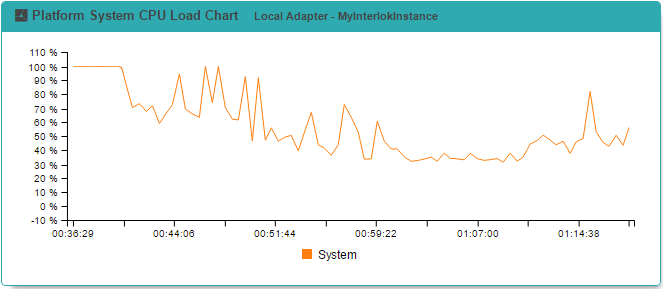
This widget shows the data from the OperatingSystemMXBean As soon as a ‘Platform System CPU Load’ or ‘Platform JVM Process Load’ widget is added by one user the system will record system cpu usage data every 20 seconds for a 24 hours period. The system will stop recording the system cpu usage and the data will be cleared if no user in the system use a ‘Platform System CPU Load’ or ‘Platform JVM Process Load’ widget for this adapter.
- X Axis – shows the time
- Y Axis – shows the system cpu usage percentage
- The System line - the amount of system cpu usage (in percent)
Platform JVM Process Load
This widget contains data concerning the cpu usage for the the Java Virtual Machine running this container.
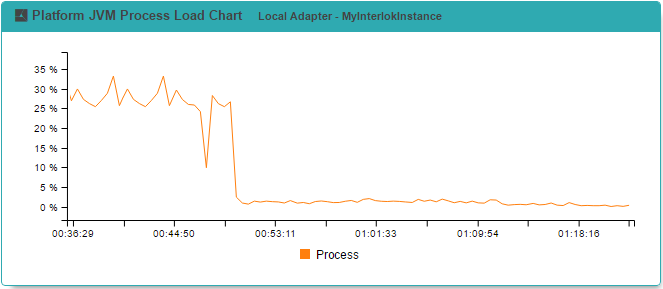
This widget shows the data from the OperatingSystemMXBean As soon as a ‘Platform System CPU Load’ or ‘Platform JVM Process Load’ widget is added by one user the system will record process cpu usage data every 20 seconds for a 24 hours period. The system will stop recording the process cpu usage and the data will be cleared if no user in the system use a ‘Platform System CPU Load’ or ‘Platform JVM Process Load’ widget for this adapter.
- X Axis – shows the time
- Y Axis – shows the process cpu usage percentage
- The System line - the amount of process cpu usage (in percent)
Platform Memory Heap Details
This widget contains data concerning the platforms memory heap.
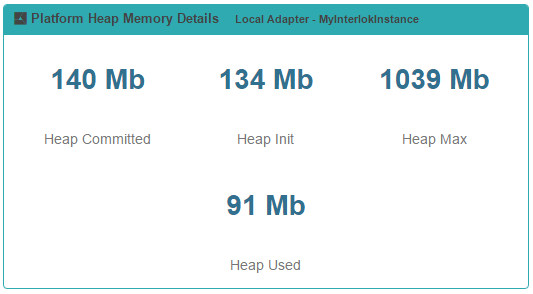
This widget shows the data from the MemoryMXBean
- Heap Committed - heap memory usage - the amount of memory (in bytes) that is guaranteed to be available for use by the Java virtual machine
- Heap Init - heap memory usage - the initial amount of memory (in bytes) that the Java virtual machine requests from the operating system for memory management during startup.
- Heap Max - heap memory usage - the maximum amount of memory (in bytes) that can be used for memory management. Its value may be undefined.
- Heap Used - heap memory usage - the amount of memory currently used (in bytes)
Platform Memory Non Heap Details
This widget contains data concerning the platforms memory non heap.
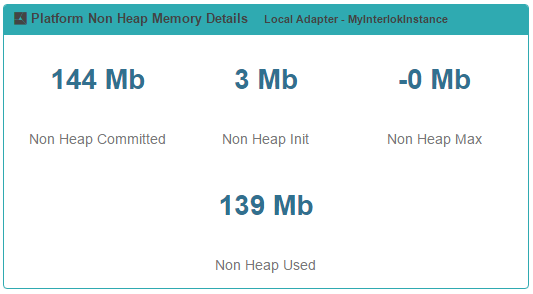
This widget shows the data from the MemoryMXBean
- Non Heap Committed - Non heap memory usage - the amount of memory (in bytes) that is guaranteed to be available for use by the Java virtual machine
- Non Heap Init - Non heap memory usage - the initial amount of memory (in bytes) that the Java virtual machine requests from the operating system for memory management during startup.
- Non Heap Max - Non heap memory usage - the maximum amount of memory (in bytes) that can be used for memory management. Its value may be undefined.
- Non Heap Used - Non heap memory usage - the amount of memory currently used (in bytes)
Platform Memory Heap
This widget contains data concerning the platforms heap memory.
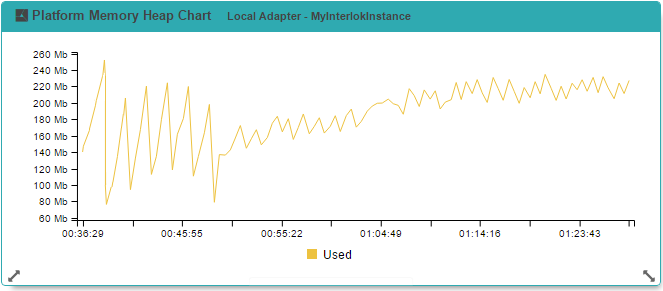
This widget shows the data from the MemoryMXBean As soon as a ‘Platform Memory Heap’ or ‘Platform Memory Non Heap’ widget is added by one user the system will record heap memory data every 20 seconds for a 24 hours period. The system will stop recording the heap memory and the data will be cleared if no user in the system use a ‘Platform Memory Heap’ or ‘Platform Memory Non Heap’ widget for this adapter.
- X Axis – shows the time
- Y Axis – shows the amount of bytes
- The Heap Used line - the amount of memory currently used (in bytes)
Platform Memory Non Heap
This widget contains data concerning the platforms non heap memory.
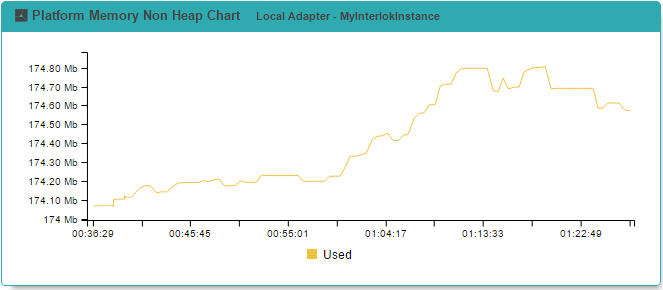
This widget shows the data from the MemoryMXBean As soon as a ‘Platform Memory Heap’ or ‘Platform Memory Non Heap’ widget is added by one user the system will record non heap memory data every 20 seconds for a 24 hours period. The system will stop recording the non heap memory and the data will be cleared if no user in the system use a ‘Platform Memory Heap’ or ‘Platform Memory Non Heap’ widget for this adapter.
- X Axis – shows the time
- Y Axis – shows the amount of bytes
- The Non Heap Used line - the amount of memory currently used (in bytes)
Container Consumer Messages Remaining
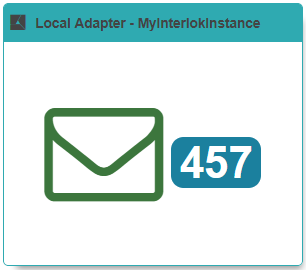
This widget display the messages remaining to be processed in all the the Container Message Consumers supported by a Consumer Monitor MBean such as the Fs Consumer. (Since 3.8)
Aggregated Adapter Widgets
(Since 3.3)
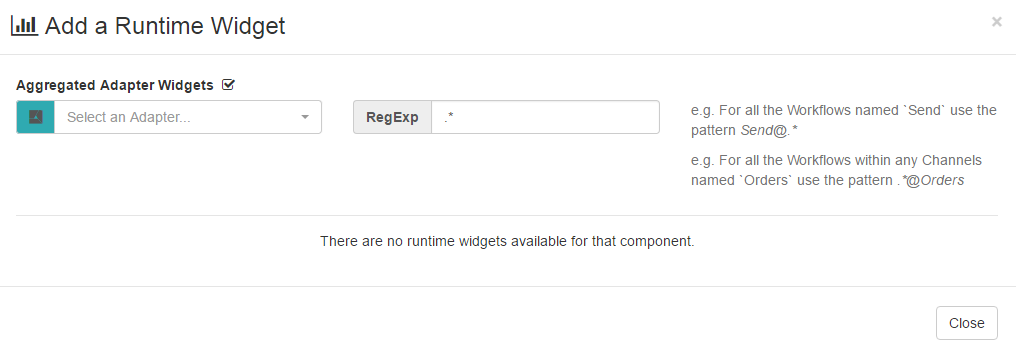
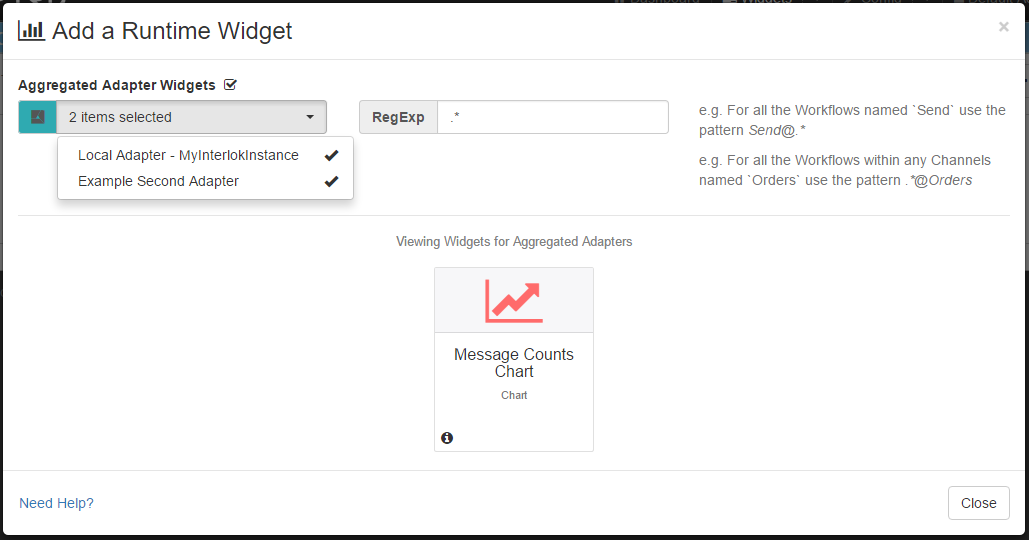
The aggregates adapter widgets (Currently only the Message Counts Chart) display data from multiple adapters on the same widget.
Check the “Aggregated Adapter Widgets” checkbox and the modal will allows you to select multiple Adapters and enter a regular expression to select Channels and/or Workflows.
Once done you will be able to select the widget and add it to the page.
Channel Widgets
Channel Details
This widget is exactly like the widget described in Container Details Widget, but the data is concerned with the selected channel.
Channel Message Counts
This widget is exactly like the widget described in Container Message Counts Chart Widget, but the data is concerned with the selected channel. Note that this widget derives its information from any configured workflow message-metrics-interceptors. If you have none configured then this widget will display no data.
message-metrics-interceptors. If you have none configured then this widget will display no data.Channel Daily Message Counts
This widget is similar to Channel Message Counts but keeps data for 24 hours. (Since 3.5.1)
Channel Control Panel
This widget is exactly like the widget described in Container Control Panel Widget, but will control a channel instead of an adapter. (Since 3.4)
Channel Consumer Messages Remaining
This widget is exactly like the widget described in Container Consumer Messages Remaining, but the data is concerned with the selected channel. (Since 3.8)
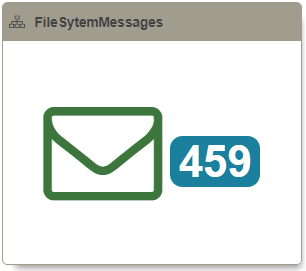
Workflow Widgets
Workflow Details
This widget is exactly like the widget described in Container Details Widget, but the data is concerned with the selected workflow.
Workflow Message Counts
This widget shows a chart that details the amount of messages and the amount of error messages that the workflow have processed.
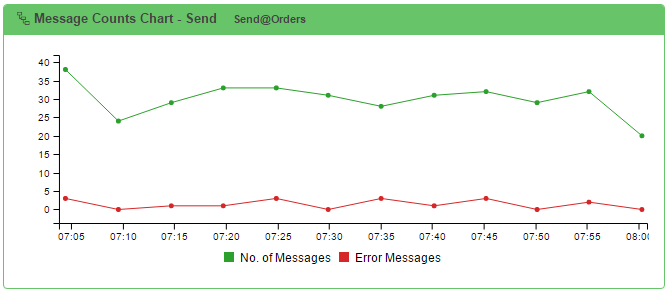
This chart shows:
- The X axis shows the time
- The Y axis shows the amount of messages or error messages processed
- One line represents the workflow messages and the other represent workflow error messages
Workflow Daily Message Counts
This widget is similar to Channel Message Counts but keeps data for 24 hours. (Since 3.5.1)
Workflow Control Panel
This widget is exactly like the widget described in Container Control Panel Widget, but will control a workflow instead of an adapter. (Since 3.4)
Workflow Message Sizes
This widget shows a chart that details the collective sizes of messages that the workflow has processed.
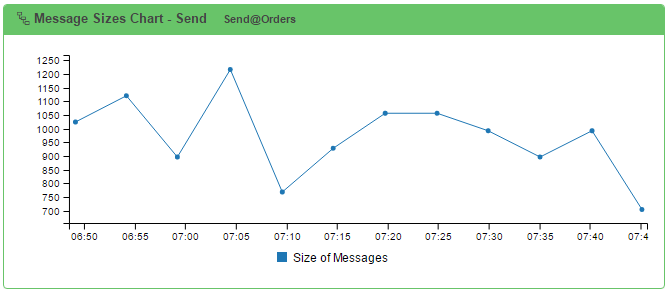
This chart shows:
- The X axis shows the time
- The Y axis shows the collective size of the messages processed
- The line represents the workflow
Workflow Message Metrics
This widget shows a table that details the collective sizes and counts of messages that the workflow has processed.
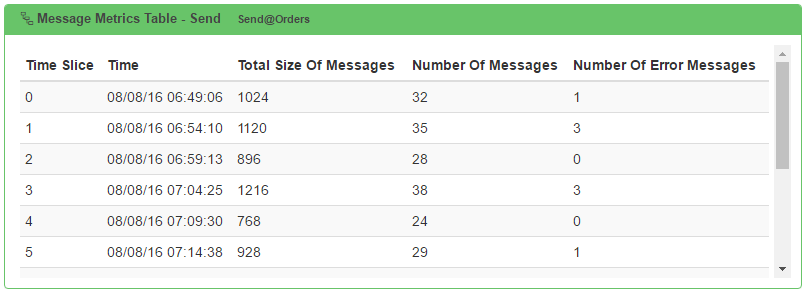
This table shows:
- Time Slice – the time slice number
- Time – the computed time that the time slice took place
- Total Size Of Messages – the total size of all the messages processed during this time slice
- Number Of Messages – the amount of messages processed during this time slice
- Number Of Error Messages – the amount of error messages processed during this time slice.
Workflow Message Statistics
This widget shows a table displaying realtime metadata counts from the messages that the workflow has processed. This widget will be enabled if a Metadata Count or Metadata Totals Interceptor has been configured for the workflow.
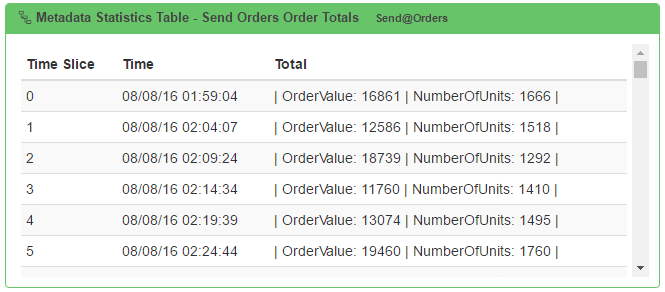
This table shows:
- Time Slice – the time slice number
- Time – the computed time that the time slice took place
- Total – the total count of metadata from all the messages processed during this time slice
Workflow Message Statistics Chart
This widget shows a chart displaying realtime metadata counts from the messages that the workflow has processed. This widget will be enabled if a Metadata Count or Metadata Totals Interceptor has been configured for the workflow.
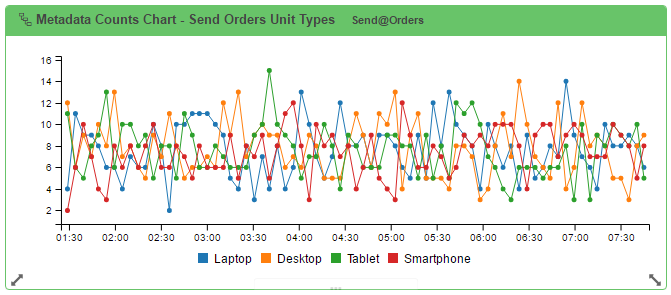
This chart shows:
- The X axis shows the time
- The Y axis shows the metadata count
- Each line represents a metadata
Workflow Message Metadata Counts Pie
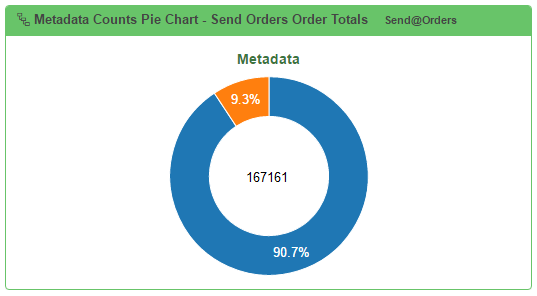
This widget shows a pie chart displaying realtime metadata counts from the messages that the workflow has processed. This widget will be enabled if a Metadata Count or Metadata Totals Interceptor has been configured for the workflow.
Workflow Consumer Messages Remaining
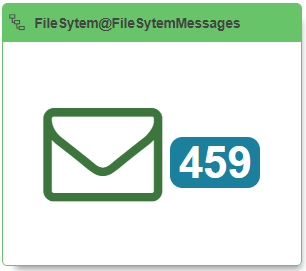
This widget is exactly like the widget described in Container Consumer Messages Remaining, but the data is concerned with the selected workflow. (Since 3.8)
Custom Widgets
(Since 3.8.2)
A custom widgets allows a user to display in a table or chart data from a given endpoint. It can be added by clicking on the Custom Widget icon in the Add Widget modal when no adapter has been selected.
![]()
Then the user will be prompted to enter some details for the endpoint.
- Name: The name of the widget
- Endpoint: The url of the endpoint where the UI will fetch data.
- RefreshTime: The data refresh interval in milliseconds.
![]()
The custom widget currently supports 3 kind of types:
Count Widget
The count widget is just an icon and a number.
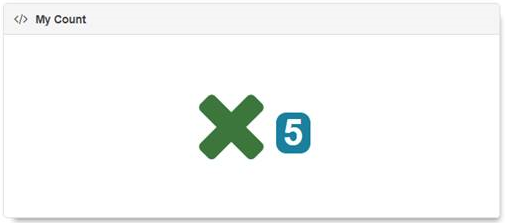
The JSON format returned by the endpoint should be like:
{
  "type" : "count",
  "data" : {
    "icon" : "times",
    "value": 5
  }
}
The icon is one icon from Font Awesome 4.7.0 icon list.
The JSON payload can be validated using the JSON schema: custom-widget-count-schema
Table Widget
The table widget display some data in a table format.
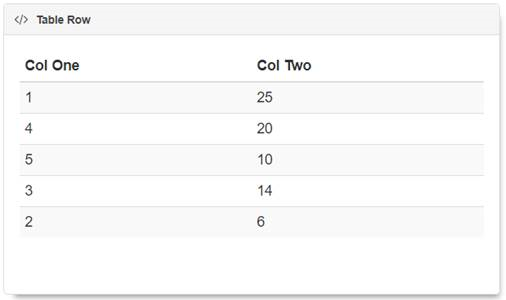
The JSON format returned by the endpoint should be like:
{
  "type" : "table",
  "data" : {
    "direction" : "rows",
    "headers": ["Col One", "Col Two"],
    "values": [
      [1, 25],
      [4, 20],
      [5, 10],
      [3, 14],
      [2, 6]
    ]
  }
}
Or
{
  "type" : "table",
  "data" : {
    "direction" : "columns",
    "headers": ["Col One", "Col Two"],
    "values": [
      [1, 4, 5 ,3 ,2],
      [25, 20, 10 ,14, 6]
    ]
  }
}
The JSON payload can be validated using the JSON schema: custom-widget-table-and-chart-schema
Chart Widget
The chart widget display some data in a chart format.
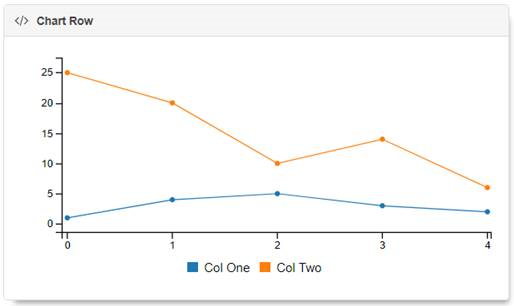
The JSON format returned by the endpoint should be like:
{
  "type" : "chart",
  "data" : {
    "type" : "line",
    "direction" : "rows",
    "headers": ["Col One", "Col Two"],
    "values": [
      [1, 25],
      [4, 20],
      [5, 10],
      [3, 14],
      [2, 6]
    ]
  }
}
Or
{
  "type" : "chart",
  "data" : {
    "type" : "line",
    "direction" : "columns",
    "headers": ["Col One", "Col Two"],
    "values": [
      [1, 4, 5 ,3 ,2],
      [25, 20, 10 ,14, 6]
    ]
  }
}
The JSON payload can be validated using the JSON schema: custom-widget-table-and-chart-schema
Where the data.type line can be line, area, scatter, bar, pie, donut, step.
The chart widget also support timeseries.
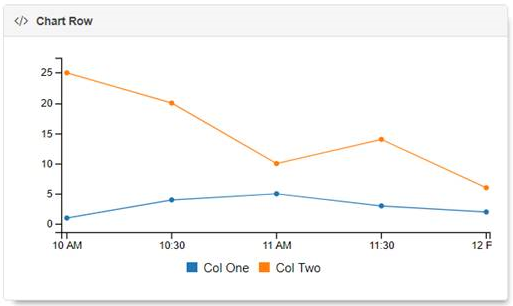
{
  "type" : "chart",
  "data" : {
    "type" : "timeseries",
    "direction" : "rows",
    "headers": ["Col One", "Col Two"],
    "x": ["10:00:00", "10:30:00", "11:00:00", "11:30:00", "12:00:00"],
    "xFormat": "%H:%M:%S",
    "values": [
      [1, 25],
      [4, 20],
      [5, 10],
      [3, 14],
      [2, 6]
    ]
  }
}
Or
{
  "type" : "chart",
  "data" : {
    "type" : "timeseries",
    "direction" : "columns",
    "headers": ["Col One", "Col Two"],
    "x": ["10:00:00", "10:30:00", "11:00:00", "11:30:00", "12:00:00"],
    "xFormat": "%H:%M:%S",
    "values": [
      [1, 4, 5 ,3 ,2],
      [25, 20, 10 ,14, 6]
    ]
  }
}
The JSON payload can be validated using the JSON schema: custom-widget-table-and-chart-schema
Widget Group
(Since 3.4)
A widget group allows a user to group multiple widgets in the same view.
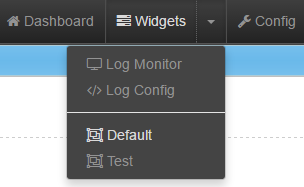
Any widget can be added to any widget group and the user can easily switch between them using the page dropdown

or the Widgets sub menu
Add Widget Group
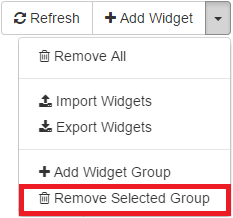
Widget Action Bar with the Add Widget Group highlighted:
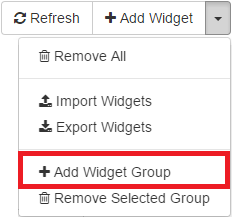
Clicking on the Add Widget Group button will open a modal window which contains a form that allows you to add a new Widget Group.
The Widget Pages Add Widget Group modal window:
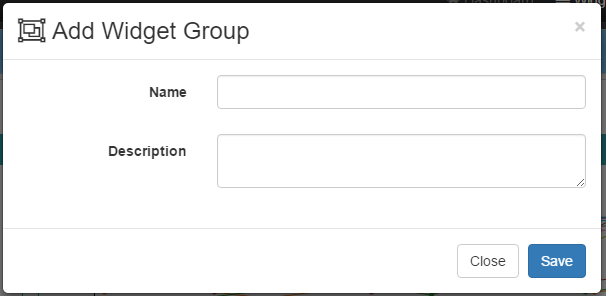
The Add Widget Group form inputs explained:
- Name: This property is for display purposes and also an easy way to differentiate Widget Groups.
- Description: A small description text to explain what this widget group is for. The selected group description will be displayed next to the widget group dropdown.
Remove Widget Group
To remove a Widget Group you will need to select it and click on the Remove Selected Group button.
