Prerequisite
As of 3.9.2 the page is still a beta feature and therefore the connected user needs to have the user preference Enable technical preview features set to true in order to see the Monitor menu item.
com.adaptris.monitor.agent.EventPropagator=JMX instead of com.adaptris.monitor.agent.EventPropagator=MULTICAST
Getting Started
To access the Profiler Monitor page, you use the monitor button on the header navigation bar.
The header navigation bar:

Monitoring
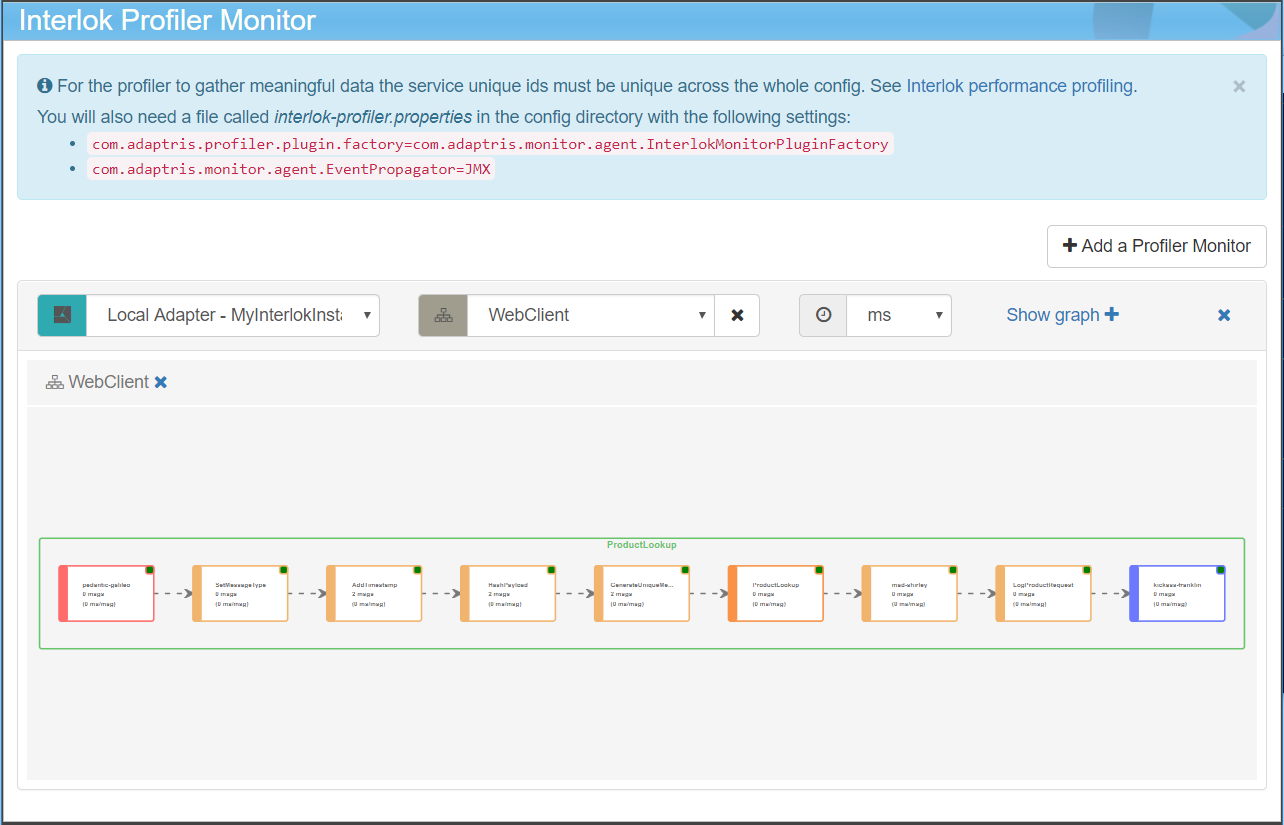
Once you’ve selected an adapter and a channel to monitor a flow diagram will be displayed showing the worklows in the selected channel. Each workflows displays its services with some near real time message processing information.

You can navigate into service lists just by clicking on them. To go back you need to use the breadcrumb above the diagram.
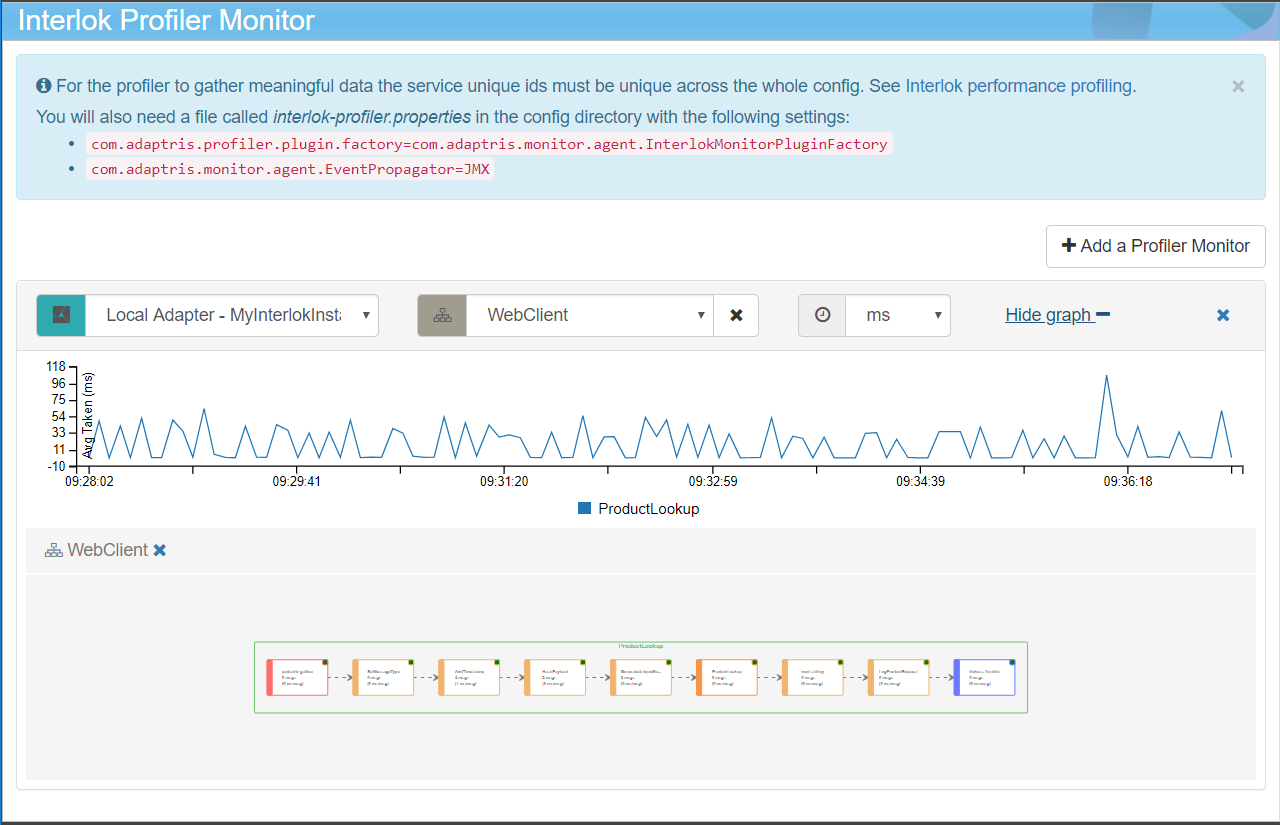
The Show Grap toggler above the diagram allows to show / hide a chart that will display the messages average taken per workflow in the selected metrics. The plot will be added in the chart only if the UI receive data from the profiler (if there is activities in the workflow).

You can add up to five monitors using the “Add a Profiler Monitor” button. Each profiler can use different adapters and/or channels.

