Since 3.10+
This document will walk you through the setup and configuration to have Interlok post profiling data directly into Prometheus. You’ll then be shown some of the basics of Prometheus and Grafana to view your Interlok metrics.
Prerequisites.
For ease of installation you will need access to a docker engine, your favourite tool for posting HTTP requests and a full Interlok 3.10+ installation. This guide uses the following;
- Windows Docker Desktop
- Interlok 3.10
- Apache JMeter
Additionally, you will also need a few jar files to drop into your Interlok installations “lib” directory. Specifically, you will need the Interlok jar files and dependent jar files from these three Interlok components;
- interlok-profiler
- interlok-profiler-prometheus
- interlok-monitor-agent
- interlok-workflow-rest-services
Docker Configuration
There are currently two methods to populate Prometheus with Interlok metrics; pushgateway and scraping. Allowing Prometheus to scrape metrics from Interlok is the preferred method, however this requires the Jetty component to be started, so if you prefer to not start Jetty then we have the pushgateway method as an alternative.
We’ll use Docker to install and run 2 or 3 components; Prometheus, Prometheus-pushgateway and Grafana. Following the steps below for each.
Prometheus Pushgateway
Skip this step if you’re running the Jetty container for Interlok.
On your command line simply run the latest Prometheus pushgateway. The run phase will automatically download the latest image before starting.
C:\>docker run -d -p 9091:9091 prom/pushgateway
Prometheus Engine
Before the engine can be installed into Docker we need to provide our own custom yml configuration file that specifies how the Prometheus engine will scrape metrics from either the pushgateway or directly from Interlok.
If you’re using the pushgateway method;
The first step is to retrieve the IP address of the pushgateway container. We do that by first getting the name of the pushgateway container with docker ps and using that name we can find the IP address of that container using docker network inspect bridge as shown below.
C:\>docker ps
CONTAINER ID        IMAGE               COMMAND              CREATED             STATUS              PORTS                    NAMES
a67e1811399d        prom/pushgateway    "/bin/pushgateway"   19 hours ago        Up 2 minutes        0.0.0.0:9091->9091/tcp   modest_elbakyan

C:\>docker network inspect bridge
[
    {
        "Name": "bridge",
        "Id": "c2ba0572abbaca0121c8ea81c2884eb074d846084af8ed7b47e1709b17a2a3de",
        "Created": "2020-01-28T19:27:20.692480072Z",
        "Scope": "local",
        "Driver": "bridge",
        "EnableIPv6": false,
        "IPAM": {
            "Driver": "default",
            "Options": null,
            "Config": [
                {
                    "Subnet": "172.17.0.0/16",
                    "Gateway": "172.17.0.1"
                }
            ]
        },
        "Internal": false,
        "Attachable": false,
        "Ingress": false,
        "ConfigFrom": {
            "Network": ""
        },
        "ConfigOnly": false,
        "Containers": {
            "a67e1811399df898974d749823f7ff3026dcd1b918213398a8d350ef4808d236": {
                "Name": "modest_elbakyan",
                "EndpointID": "3a38303df15c44156aedaa4163490dc5db5e494451fc87348b8003a7027abb0d",
                "MacAddress": "02:42:ac:11:00:02",
                "IPv4Address": "172.17.0.2/16",
                "IPv6Address": ""
            }
        },
        "Options": {
            "com.docker.network.bridge.default_bridge": "true",
            "com.docker.network.bridge.enable_icc": "true",
            "com.docker.network.bridge.enable_ip_masquerade": "true",
            "com.docker.network.bridge.host_binding_ipv4": "0.0.0.0",
            "com.docker.network.bridge.name": "docker0",
            "com.docker.network.driver.mtu": "1500"
        },
        "Labels": {}
    }
]
From the above out of the first command we can see the containers name is modest_elbakyan. From the output of the second command we can see that I actually only have one container running and the name matches the one above for which the IP address is 172.17.0.2.
Now we need to create a new configuration file for Prometheus, simply name this file prometheus.yml. The content of the file will look like the following (remember to switch the IP address of the pushgateway to the yours as shown above;
global:
  scrape_interval: 15s

scrape_configs:
  - job_name: 'prometheus'
    scrape_interval: 5s
    static_configs:
      - targets: ['localhost:9090']

  - job_name: 'pushgateway'
    honor_labels: true
    static_configs:
      - targets: ['172.17.0.2:9091']
Now you can simply start the Prometheus engine with the full path to your new configuration file like this;
docker run -d -v C:\prometheus.yml:/etc/prometheus/prometheus.yml -p 9090:9090 prom/prometheus
If you’re using the Prometheus scrape method;
Create a new file named prometheus.yml with the following content;
global:
  scrape_interval: 15s

scrape_configs:
  - job_name: 'prometheus'
    scrape_interval: 5s
    static_configs:
      - targets: ['localhost:9090']

  - job_name: 'interlok'
    honor_labels: true
    scrape_interval: 5s
    metrics_path: 'prometheus/metrics'
    static_configs:
      - targets: ['host.docker.internal:8082']
Now modify the target host and port name on the last line to point to your installation of Interlok.
Finally start Prometheus with the full path to your new configuration file like this;
docker run -d -v C:\prometheus.yml:/etc/prometheus/prometheus.yml -p 9090:9090 prom/prometheus
Grafana
There are simply two stages to the Grafana setup, the first is to run it in Docker and then we simply setup the Prometheus data-source. We’ll be playing around with Grafana a little later in this guide, but for now start it up;
docker run -d -p 3000:3000 grafana/grafana
Now you can log into Grafana with your browser on http://localhost:3000 .
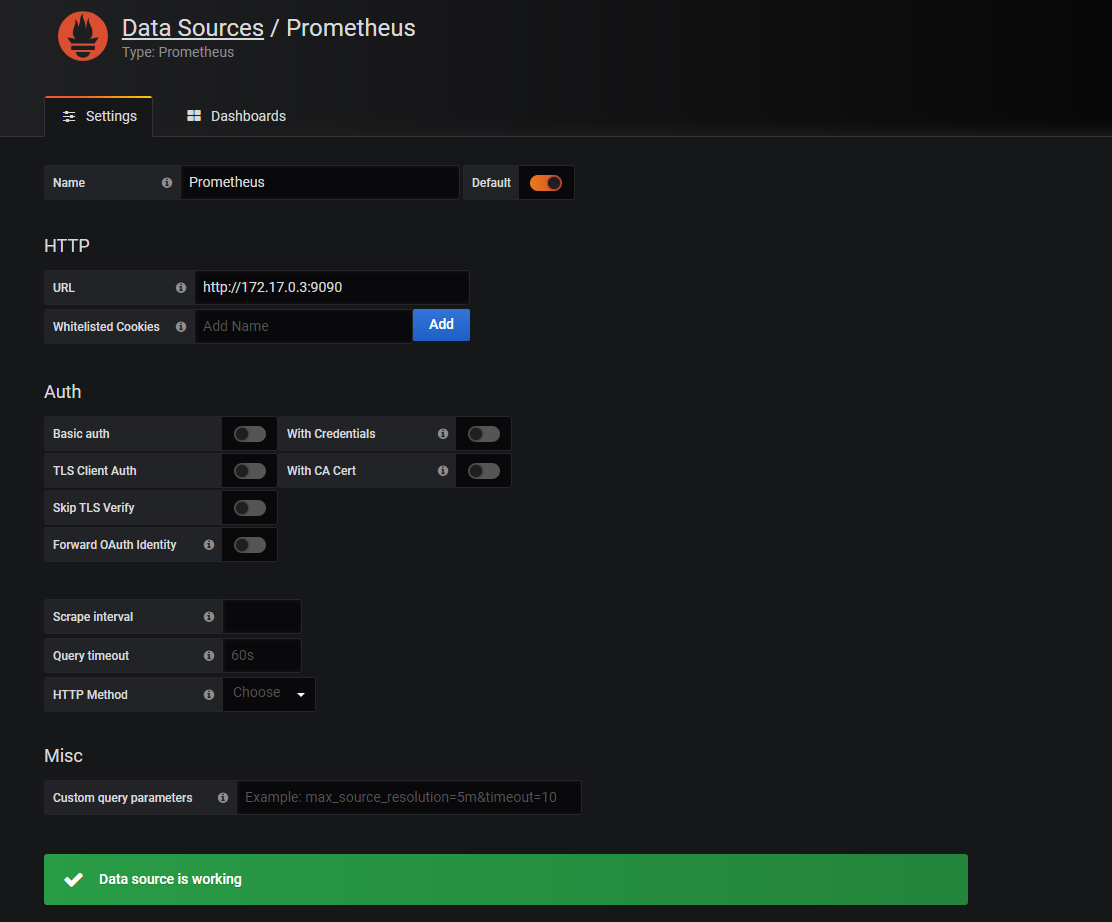
The default username and password is usually admin for both. You should then be prompted to create a new data source. For this we’ll need the Prometheus engines container IP address/host name. Using the same two commands as shown in the previous section; docker ps and docker network inspect bridge, find the IP address of the Prometheus engine, not the pushgateway. Choose Prometheus as the data source type and enter the host with your IP address as shown below;
Interlok
In this guide we will be using a fairly simple Interlok configuration with two workflows that accept HTTP requests, run some services and simply return the result to the caller. You can absolutely use any Interlok configuration you wish, but if you wish to use the same one as this guide, you can find a full copy at the very bottom of this guide. Simply copy the content into the file named adapter.xml in your Interlok config directory.
Assuming you have installed the required jar files as mentioned at the top of this document, we now need to configure the interlok-profiler and the specify the Prometheusmetric population method.
When running the profiler it is always suggested to create your own scrip to launch the Interlok process. Essentially we need to start the Java process with a javaagent, with the profiling configuration. Here is a windows batch script (start-interlok-with-profiler.bat) that does the necessary;
setlocal ENABLEDELAYEDEXPANSION

set CLASSPATH=.
set INTERLOK_HOME=C:\Adaptris\3.10
set JAVA_HOME=C:\Java\Zulu\zulu-8\bin

set CLASSPATH=%CLASSPATH%;%INTERLOK_HOME%\lib\*;%INTERLOK_HOME%\config

set ASPECT_OPTIONS=-Dorg.aspectj.weaver.loadtime.configuration=META-INF/profiler-aop.xml

%JAVA_HOME%\java -cp %CLASSPATH% -javaagent:lib/aspectjweaver.jar %ASPECT_OPTIONS% -jar ./lib/interlok-boot.jar
If you drop this batch file into the root of your Interlok installation, you should only need to change the JAVA_HOME and the INTERLOK_HOME properties to match your correct paths. There is one more final thing to check however, the final line specifies a jar file named aspectweaver.jar in the lib directory of your Interlok installation. Make sure your script has the same name of the actual aspectweaver jar in your lib directory, just in case the jar file is named something slightly different.
Now we need a new file in your config directory of your Interlok installation named interlok-profiler.properties. The content of this file should be the following;
com.adaptris.profiler.plugin.factory=com.adaptris.monitor.agent.InterlokMonitorPluginFactory
com.adaptris.monitor.agent.EventPropagator=JMX
If you’ve chosen to use the pushgateway to populate Prometheus
Finally, we need to configure the Prometheus pushgateway endpoint for Interlok and make sure the interlok-profiler-prometheus management component starts up. Edit the file named bootstrap.properties in your config directory at the root of your Interlok installation. Add the management component named profiler-prometheus to the management component list and add an additional property named prometheusEndpointUrl as shown below;
# What management components to enable.
managementComponents=jetty:jmx:profiler-prometheus

# The adapter config files, primary + secondary.
adapterConfigUrl.0=file://localhost/./config/FSx.xml
adapterConfigUrl.1=file://localhost/./config/adapter-backup.xml

# Configuration for jetty.
webServerConfigUrl=./config/jetty.xml

# configuration for JMX
jmxserviceurl=service:jmx:jmxmp://localhost:5555

# System Property needs to be set; equivalent to "-Dorg.jruby.embed.localcontext.scope=threadsafe"
sysprop.org.jruby.embed.localcontext.scope=threadsafe

# System Property that tells jboss logging to use slf4j.
sysprop.org.jboss.logging.provider=slf4j

preProcessors=xinclude:variableSubstitution:environmentVariables

prometheusEndpointUrl=localhost:9091
This assumes you’re running Interlok on the same host as your Docker engine. If you are not, then change the localhost part of the Url to the IP/host of the Prometheus pushgateway Docker container.
If you’ve chosen to use the scraping method to populate Prometheus
Simply modify Interlok’s bootstrap.properties to include a new management component named prometheus-rest, also make sure the colon separated list includes jetty and jmx as shown below;
# What management components to enable.
managementComponents=jetty:jmx:prometheus-rest
The metrics
The following will become important later when we start querying for metrics in Grafana.
Currently Interlok pushes two types of metrics; the number of messages processed and the average amount of time a component takes to process a single message.
For the number of messages processed by a workflow the metric name pushed to Prometheus will be prefixed with the following workflowMessageCount followed by an underscore and then the unique id of the workflow. Do be aware however, if your workflow name (unique id) has any of the following characters they will be stripped when creating the metric name; dot, dash or underscore.
An example would be if you have a workflow named my_Message_Workflow, then the metric to record the number of messages processed by this workflow will be named workflowMessageCount_myMessageWorkflow.
Additionally to workflow message counting, we also push average processing times for each service and producer in your workflows. We publish separate metrics both in milliseconds and nanoseconds. The names of these metrics take the same rules and have a similar form to the above.
For service metrics the metric name will be prefixed by serviceAvgNanos for nanosecond timing and serviceAvgMillis for millisecond timing.
For service metrics the metric name will be prefixed by producerAvgNanos for nanosecond timing and producerAvgMillis for millisecond timing.
After the prefix and underscore followed by the parent workflow name, then followed by another underscore and then name of the service or producer component will make up the entire service/producer metric name.
For example, if you have a producer named my_Jms_Producer in the workflow named my_Message_Workflow, then two metrics will be published to Prometheus; producerAvgMillis_myMessageWorkflow_myJmsProducer and producerAvgNanos_myMessageWorkflow_myJmsProducer.
Loading messages into Interlok
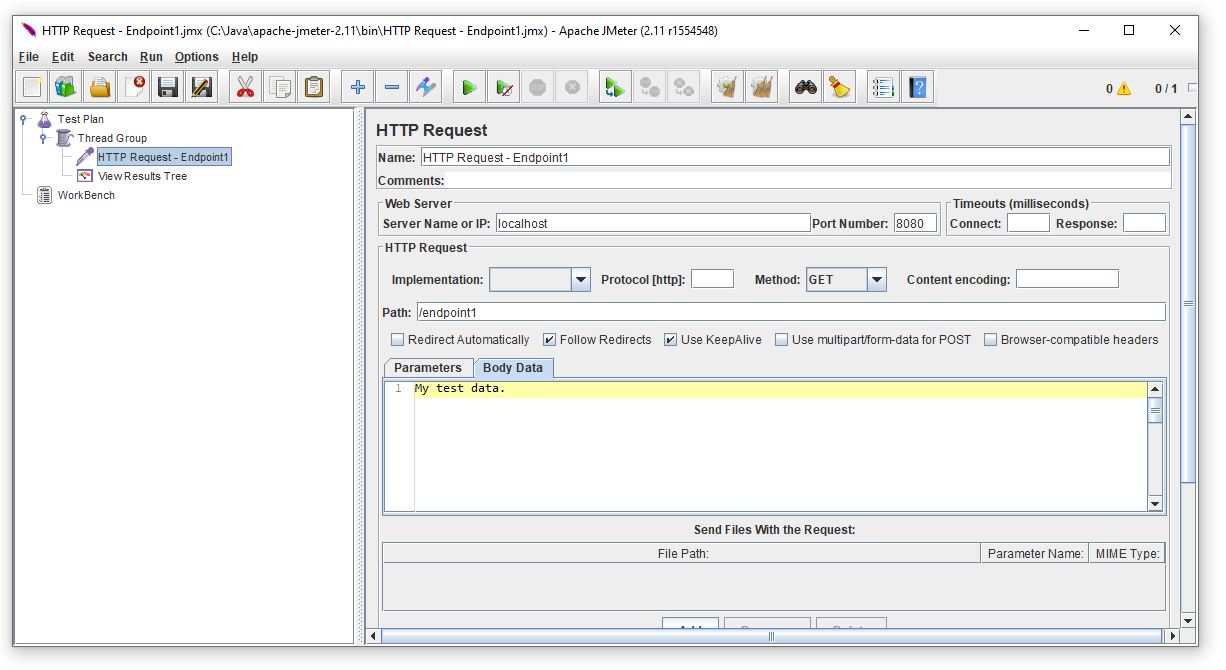
If you’re using the same configuration as this guide then use your HTTP posting tool to inject messages into Interlok. Here we’re use Apache JMeter, the basic configuration looks like the following.
Continually fire messages into Interlok for a few seconds or so and then move onto the next section to see the results of those metrics.
Grafana
You should have created the Prometheus data source in Grafana in a previous section so now you will create a new dashboard which will allow you to create new queries. This guide will not go into detail on how to use Grafana or the power of Prometheus’s query language, but we can show a couple of potentially useful queries below.
Note: The following queries may need to be changed to match your workflows unique id’s, if you are not using this guides configuration.
Using the query;
{__name__=~"workflowMessageCount.*"}
In the following configuration window;
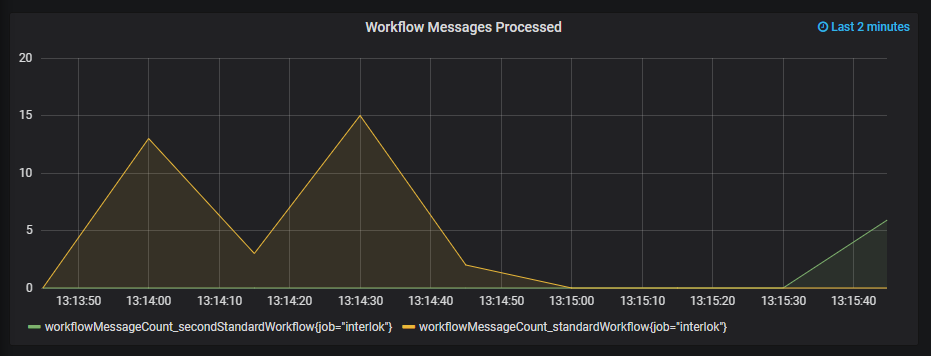
We end up with the following messages processed by workflow chart;
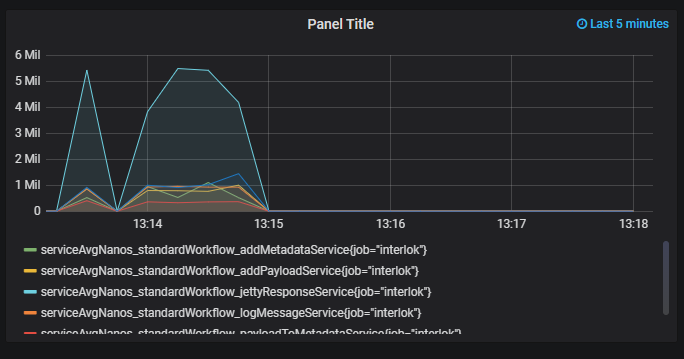
We can also see the time in nanoseconds that each service in the workflow named standardWorkflow takes to process each message with the following query;
{__name__=~"serviceAvgNanos_standardWorkflow.*"}
Sample Configuration
<adapter>
  <unique-id>MyInterlokInstance</unique-id>
  <start-up-event-imp>com.adaptris.core.event.StandardAdapterStartUpEvent</start-up-event-imp>
  <heartbeat-event-imp>com.adaptris.core.HeartbeatEvent</heartbeat-event-imp>
  <shared-components>
    <connections/>
    <services/>
  </shared-components>
  <event-handler class="default-event-handler">
    <unique-id>DefaultEventHandler</unique-id>
    <connection class="null-connection">
      <unique-id>reverent-noyce</unique-id>
    </connection>
    <producer class="null-message-producer">
      <unique-id>gigantic-feynman</unique-id>
    </producer>
  </event-handler>
  <message-error-handler class="null-processing-exception-handler">
    <unique-id>tender-goodall</unique-id>
  </message-error-handler>
  <failed-message-retrier class="no-retries">
    <unique-id>pensive-boyd</unique-id>
  </failed-message-retrier>
  <channel-list>
    <channel>
      <consume-connection class="jetty-embedded-connection">
        <unique-id>embeddedJettyConnection</unique-id>
      </consume-connection>
      <produce-connection class="null-connection">
        <unique-id>cranky-nightingale</unique-id>
      </produce-connection>
      <workflow-list>
        <standard-workflow>
          <consumer class="jetty-message-consumer">
            <message-factory class="multi-payload-message-factory">
              <default-char-encoding>UTF-8</default-char-encoding>
              <default-payload-id>default-payload</default-payload-id>
            </message-factory>
            <unique-id>httpMessageConsumer</unique-id>
            <destination class="configured-consume-destination">
              <destination>/endpoint1</destination>
            </destination>
            <parameter-handler class="jetty-http-ignore-parameters"/>
            <header-handler class="jetty-http-ignore-headers"/>
          </consumer>
          <service-collection class="service-list">
            <unique-id>hopeful-mayer</unique-id>
            <services>
              <payload-to-metadata>
                <unique-id>payloadToMetadataService</unique-id>
                <key>payload</key>
                <metadata-target>Standard</metadata-target>
                <encoding>None</encoding>
              </payload-to-metadata>
              <add-payload-service>
                <unique-id>addPayloadService</unique-id>
                <new-payload-id>my-new-payload</new-payload-id>
                <new-payload class="metadata-data-input-parameter">
                  <metadata-key>payload</metadata-key>
                </new-payload>
              </add-payload-service>
              <switch-payload-service>
                <unique-id>switchPayloadService</unique-id>
                <new-payload-id>my-new-payload</new-payload-id>
              </switch-payload-service>
              <log-message-service>
                <unique-id>logMessageService</unique-id>
                <log-level>DEBUG</log-level>
              </log-message-service>
              <add-metadata-service>
                <unique-id>addMetadataService</unique-id>
                <metadata-element>
                  <key>myKey</key>
                  <value>myValue</value>
                </metadata-element>
              </add-metadata-service>
              <jetty-response-service>
                <unique-id>jettyResponseService</unique-id>
                <http-status>200</http-status>
                <content-type>text/plain</content-type>
                <response-header-provider class="jetty-no-response-headers"/>
              </jetty-response-service>
            </services>
          </service-collection>
          <producer class="null-message-producer">
            <unique-id>nullProducer</unique-id>
          </producer>
          <produce-exception-handler class="null-produce-exception-handler"/>
          <unique-id>standardWorkflow</unique-id>
          <message-metrics-interceptor>
            <unique-id>standardWorkflow-MessageMetrics</unique-id>
            <timeslice-duration>
              <unit>MINUTES</unit>
              <interval>5</interval>
            </timeslice-duration>
            <timeslice-history-count>12</timeslice-history-count>
          </message-metrics-interceptor>
          <in-flight-workflow-interceptor>
            <unique-id>standardWorkflow-InFlight</unique-id>
          </in-flight-workflow-interceptor>
        </standard-workflow>
        <standard-workflow>
          <consumer class="jetty-message-consumer">
            <message-factory class="multi-payload-message-factory">
              <default-char-encoding>UTF-8</default-char-encoding>
              <default-payload-id>default-payload</default-payload-id>
            </message-factory>
            <unique-id>secondHttpMessageConsumer</unique-id>
            <destination class="configured-consume-destination">
              <destination>/endpoint2</destination>
            </destination>
            <parameter-handler class="jetty-http-ignore-parameters"/>
            <header-handler class="jetty-http-ignore-headers"/>
          </consumer>
          <service-collection class="service-list">
            <unique-id>hopeful-mayer</unique-id>
            <services>
              <payload-to-metadata>
                <unique-id>secondPayloadToMetadataService</unique-id>
                <key>payload</key>
                <metadata-target>Standard</metadata-target>
                <encoding>None</encoding>
              </payload-to-metadata>
              <add-payload-service>
                <unique-id>secondAddPayloadService</unique-id>
                <new-payload-id>my-new-payload</new-payload-id>
                <new-payload class="metadata-data-input-parameter">
                  <metadata-key>payload</metadata-key>
                </new-payload>
              </add-payload-service>
              <switch-payload-service>
                <unique-id>secondSwitchPayloadService</unique-id>
                <new-payload-id>my-new-payload</new-payload-id>
              </switch-payload-service>
              <log-message-service>
                <unique-id>secondLogMessageService</unique-id>
                <log-level>DEBUG</log-level>
              </log-message-service>
              <add-metadata-service>
                <unique-id>secondAddMetadataService</unique-id>
                <metadata-element>
                  <key>myKey</key>
                  <value>myValue</value>
                </metadata-element>
              </add-metadata-service>
              <jetty-response-service>
                <unique-id>secondJettyResponseService</unique-id>
                <http-status>200</http-status>
                <content-type>text/plain</content-type>
                <response-header-provider class="jetty-no-response-headers"/>
              </jetty-response-service>
            </services>
          </service-collection>
          <producer class="null-message-producer">
            <unique-id>secondNullProducer</unique-id>
          </producer>
          <produce-exception-handler class="null-produce-exception-handler"/>
          <unique-id>secondStandardWorkflow</unique-id>
          <message-metrics-interceptor>
            <unique-id>standardWorkflow-MessageMetrics</unique-id>
            <timeslice-duration>
              <unit>MINUTES</unit>
              <interval>5</interval>
            </timeslice-duration>
            <timeslice-history-count>12</timeslice-history-count>
          </message-metrics-interceptor>
          <in-flight-workflow-interceptor>
            <unique-id>standardWorkflow-InFlight</unique-id>
          </in-flight-workflow-interceptor>
        </standard-workflow>
      </workflow-list>
      <unique-id>http_channel</unique-id>
    </channel>
  </channel-list>
  <message-error-digester class="standard-message-error-digester">
    <unique-id>ErrorDigest</unique-id>
    <digest-max-size>100</digest-max-size>
  </message-error-digester>
</adapter>


