Getting Started
To access the Log Monitor page, you use the log monitor button on the header navigation bar.
The header navigation bar:

Log Monitor
User Preferences
In the ‘User Preferences’, there is a Log Monitor Page Preference that allows you to reverse the order that the log lines are shown.
Note: You have to refresh the log monitor page for this change to occur
Add Log Monitor
To add a new log monitor click on the ‘+’ tab on the top left corner of the page

Clicking on the ‘+’ button will open the Add Log Monitor modal window which contains a form that allows you to register an Adapter to the UI.
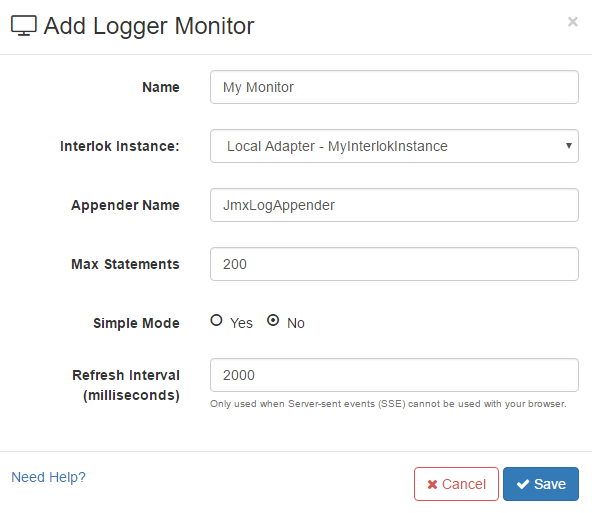
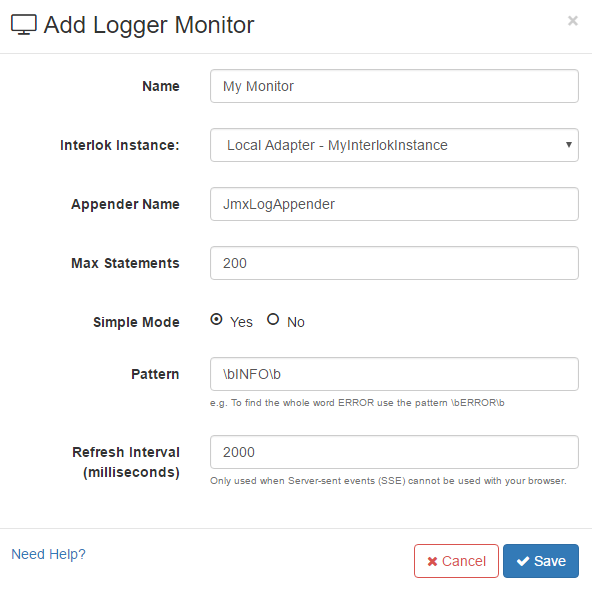
The Add Log Monitor form inputs explained:
- Name: This property is for display purposes and also an easy way to differentiate Log Monitors registered within the UI web application.
- Interlok Instance: This is the name of the Adapter instance you want to monitor.
- Appender Name: This is the name of the configured Jmx appender, one or more appenders can be configured in the log4j2.xml file.
- Max Statements: This is the number of log statements the web console will keep in memory. Too much will slow down the page and too little may not give enough information. The default is 200.
- Simple Mode: If this option is set to Yes, a Pattern text field will be shown allowing to enter a regular expression to filter all the log, e.g. if you are only interested by INFO logs you can add
\bINFO\b. In simple mode no sub filter can be added. (Since 3.5.0) - Refresh Interval: This property is only used if your browser doesn’t support Server-sent events (SSE) and a polyfill could not be applied. However all modern browsers should work with SSE.
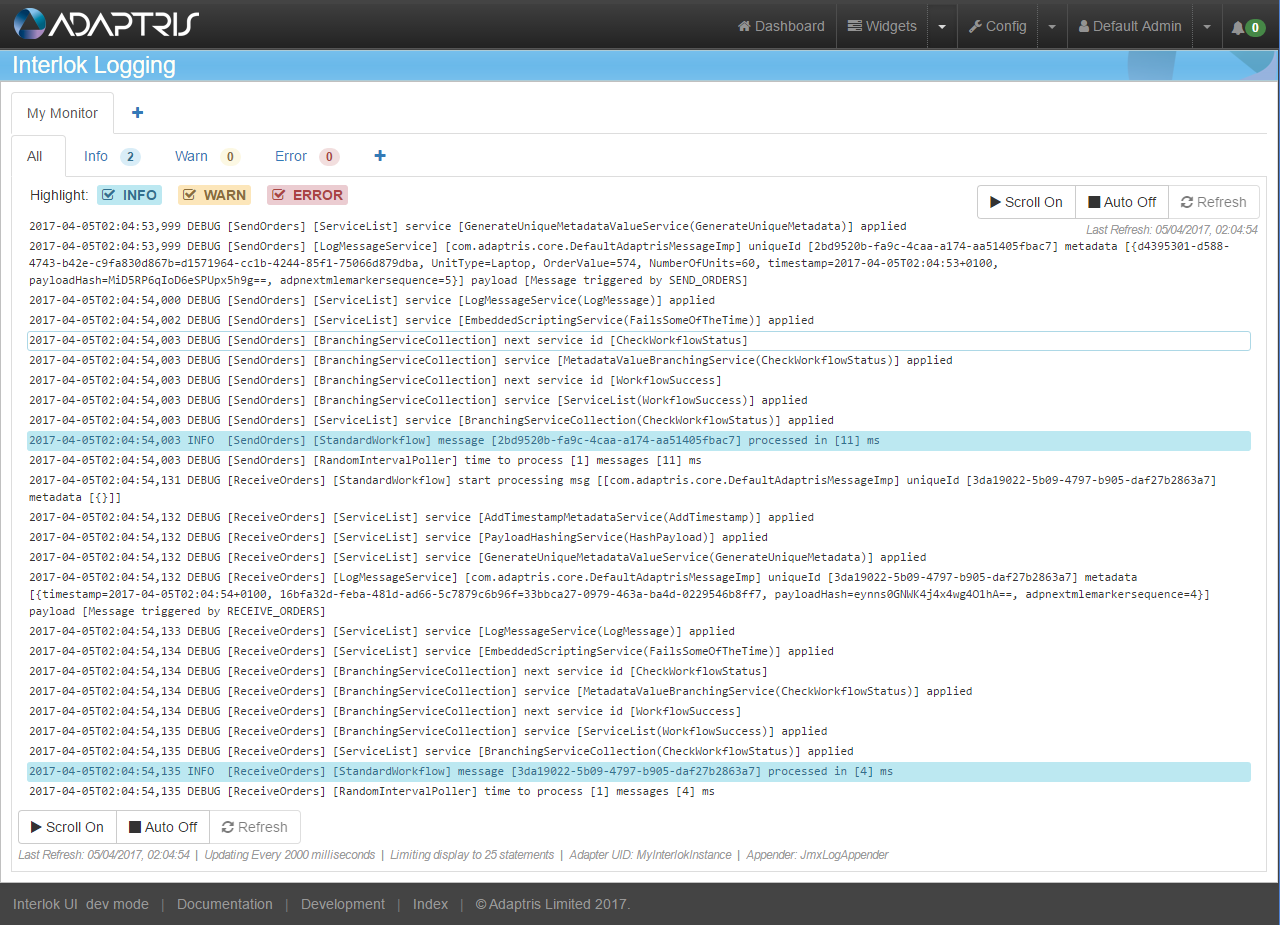
Once the new Log monitor has been saved the console should start showing logs (if some logs are generated by the Adapter).
For example in the containers config/log4j2.xml you would add a new appender:
<JmxLogAppender name="JmxLogAppender">
	<PatternLayout>
		<Pattern>%d{ISO8601} %-5p [%t] [%c{1}] %m%n</Pattern>
    </PatternLayout>
	<filters>
		<ThresholdFilter level="info"/>
	</filters>
</JmxLogAppender>
And you would have to add a new element to the root element:
<Root level="TRACE">
	<AppenderRef ref="Console"/>
	<AppenderRef ref="JmxLogAppender"/>
</Root>
As well as log4j config, you would have to put the interlok-logging.jar into the containers lib folder.
The Log Monitor action bar

The actions are as follows:
| Button | Action | Meaning |
|---|---|---|
 |
Scroll On/Off | Turn on or off the auto scrolling of the console to follow the new log statements. |
 |
Auto On/Off | Turn on or off the auto refresh. If turn off no new log statements will be added to the console. |
 |
Refresh | Refresh the console (This button is only used if your browser doesn’t support Server-sent events (SSE). |
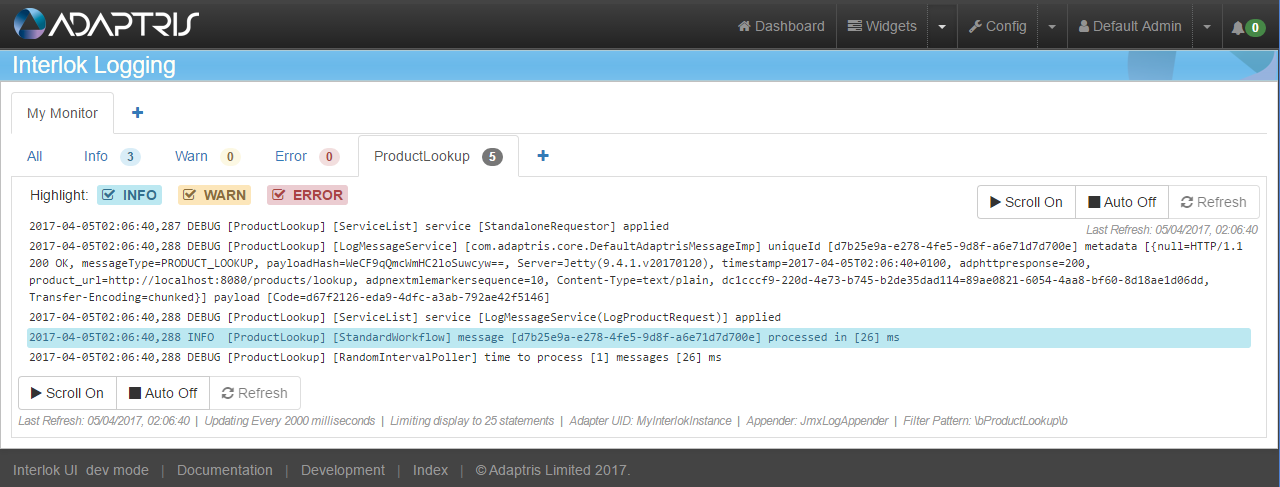
Log Monitor Filter
Every new Log Monitor comes with four pre-configured sub-tabs:
- All: Display all the logs from the jmx appender. This sub-tab as highlighters to make info, warn and error logs stand out.
- Info: Only display info logs.
- Warn: Only display warning logs.
- Error: Only display error logs.
Add Log Monitor Filter
You can also add a customise sub-tab by clicking on the ‘+’ button on the right-hand side of the Error sub-tab.
Clicking on the ‘+’ button will open the Add Log Monitor Filter modal window which contains a form that allows you to register a new Filter to the Log Monitor.
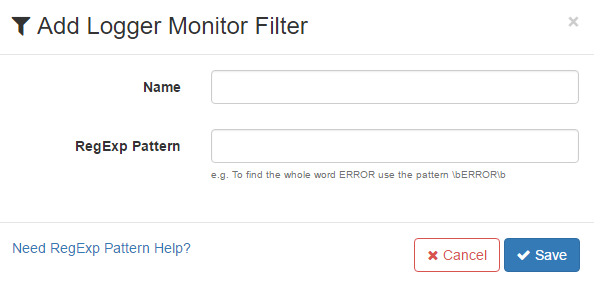
The Add Log Monitor Filter form inputs explained:
- Name: This property is for display purposes and also an easy way to differentiate Filters registered within the Log Monitor.
- RexExp Pattern: This is the regular expression used to match log statements with this filter. For instance, if you want to display only logs for the ProductLookup Workflow you can use
.*\[ProductLookup\].*. You can find more help on regular expression.
Once the new filter has been saved it will be automatically selected.
